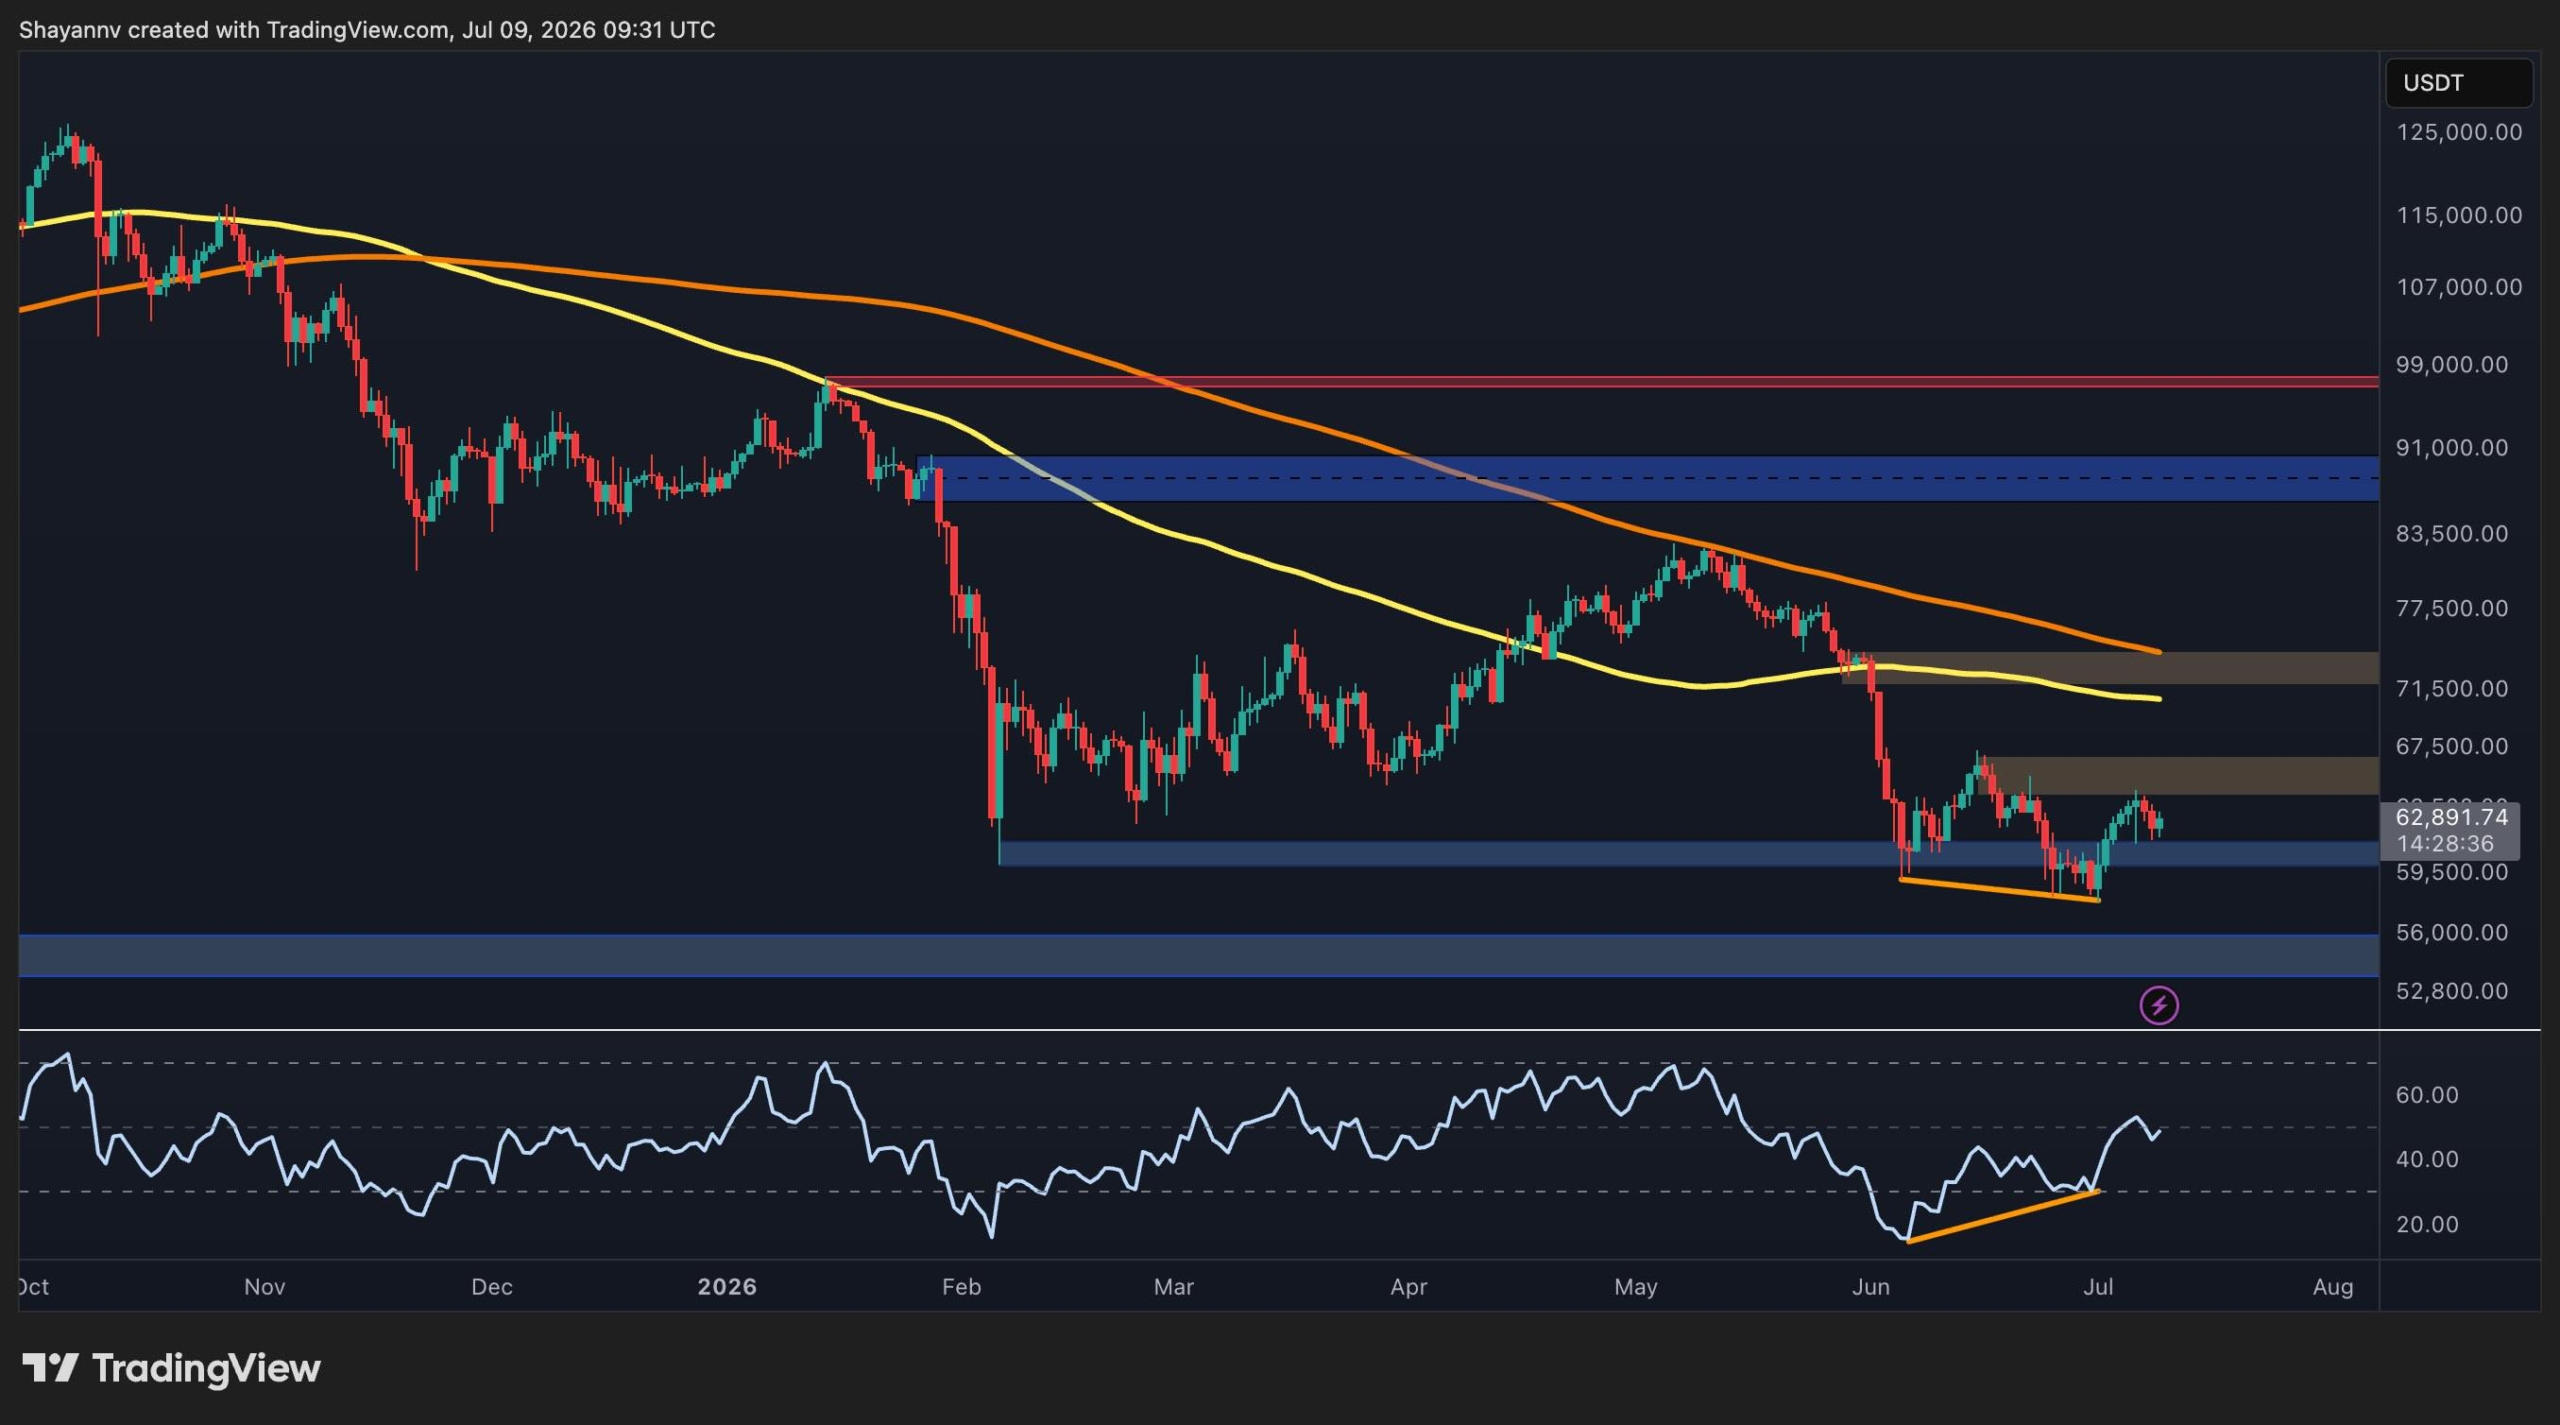
Bitcoin has surged back to the $64,000 mark, showing signs of short-term stabilization, but it has not yet fully escaped its long-term bearish technical structure.
Bitcoin has reclaimed the $64,000 level, but analysts warn that it remains in a technical 'danger zone' until it consistently closes above key moving averages.
After weeks of uncertainty, Bitcoin (BTC) has finally shown some muscle by climbing back above the psychologically important $64,000 level. This move has given American retail investors a reason to breathe, yet the broader market context remains complex.
While the momentum on shorter timeframes is clearly improving, the asset is still fighting against a larger downtrend. For those trading on major US exchanges like Coinbase or Kraken, the next few days will determine if this is a genuine recovery or a "bull trap" (a false signal showing a declining trend has reversed when it has not).
The Technical Battle for $64,000
The recent price action suggests that Bitcoin has found a temporary bottom. However, technical analysts point out that BTC is still trading below several key moving averages (the average price of an asset over a specific period, used to smooth out price data).
To officially clear the "danger zone," Bitcoin needs to flip previous resistance levels into support. If the price fails to hold above $64,000, we could see a quick retest of lower demand zones. Currently, the market is seeing a tug-of-war between optimistic buyers and large-scale sellers.
"While short-term relief is welcome, the macro trend for Bitcoin remains cautious until we see a definitive breakout above the 200-day moving average."
On-Chain Data and Whale Behavior
Looking under the hood at on-chain data (information recorded directly on the blockchain), the picture is mixed. Large holders, often referred to as "whales," haven't fully committed to this rally yet. Some data indicates that some high-net-worth investors are still sitting on the sidelines or even taking profits into the strength.
For mid-level investors, it’s important to understand the broader ecosystem of Decentralized Finance (DeFi) where these assets are often used as collateral. If you are looking to learn more about these structures, check out this Investopedia DeFi explainer to see how price swings impact the wider market.
Key metrics to watch for a sustained bull run include:
- Exchange Outflows: More Bitcoin leaving exchanges usually signals long-term holding.
- Stablecoin Inflows: New capital entering the market to buy dips.
- Funding Rates: Gauging whether traders are leaning too far into "long" positions.
Is the Macro Downtrend Over?
Despite the recent surge (a sudden and powerful forward or upward movement), Bitcoin is still facing heavy overhead resistance. Sellers are historically active in the $65,000 to $67,000 range. Until these levels are cleared with high trading volume, the risk of a reversal remains high.
- Identify Resistance: Watch the $66,000 level for signs of selling pressure.
- Confirm Support: Ensure $62,000 holds if a pullback occurs.
- Check Volume: Authentic rallies are backed by high trading activity.
US investors should also pay attention to the Dollar Strength Index (DXY). Historically, when the US dollar weakens, Bitcoin tends to perform better as an alternative store of value.
What This Means for USA Investors
For Americans, the current Bitcoin price action coincides with significant regulatory and tax considerations. The Internal Revenue Service (IRS) treats Bitcoin as property, meaning every time you trade BTC for another coin or USD on an exchange, you trigger a taxable event.
From a regulatory standpoint, the SEC (Securities and Exchange Commission) and CFTC (Commodity Futures Trading Commission) continue to monitor the space closely. This price surge happens as US-based Spot Bitcoin ETFs (Exchange Traded Funds) see fluctuating inflows, which directly impacts the spot price on domestic exchanges like Gemini.
Always remember that while Bitcoin is available 24/7, the most significant price movements often occur during the New York Stock Exchange trading hours due to the heavy influence of institutional capital in the United States.
Key Takeaways
- Monitor the $64,000 support level to ensure the current rally has staying power.
- Watch for heavy overhead resistance that could trigger a sudden price rejection.
- Track whale movements as on-chain data suggests large holders are still cautious.
- Evaluate long-term moving averages to determine if the macro downtrend has truly ended.
- Prepare for volatility as US economic data continues to influence Bitcoin's price action.