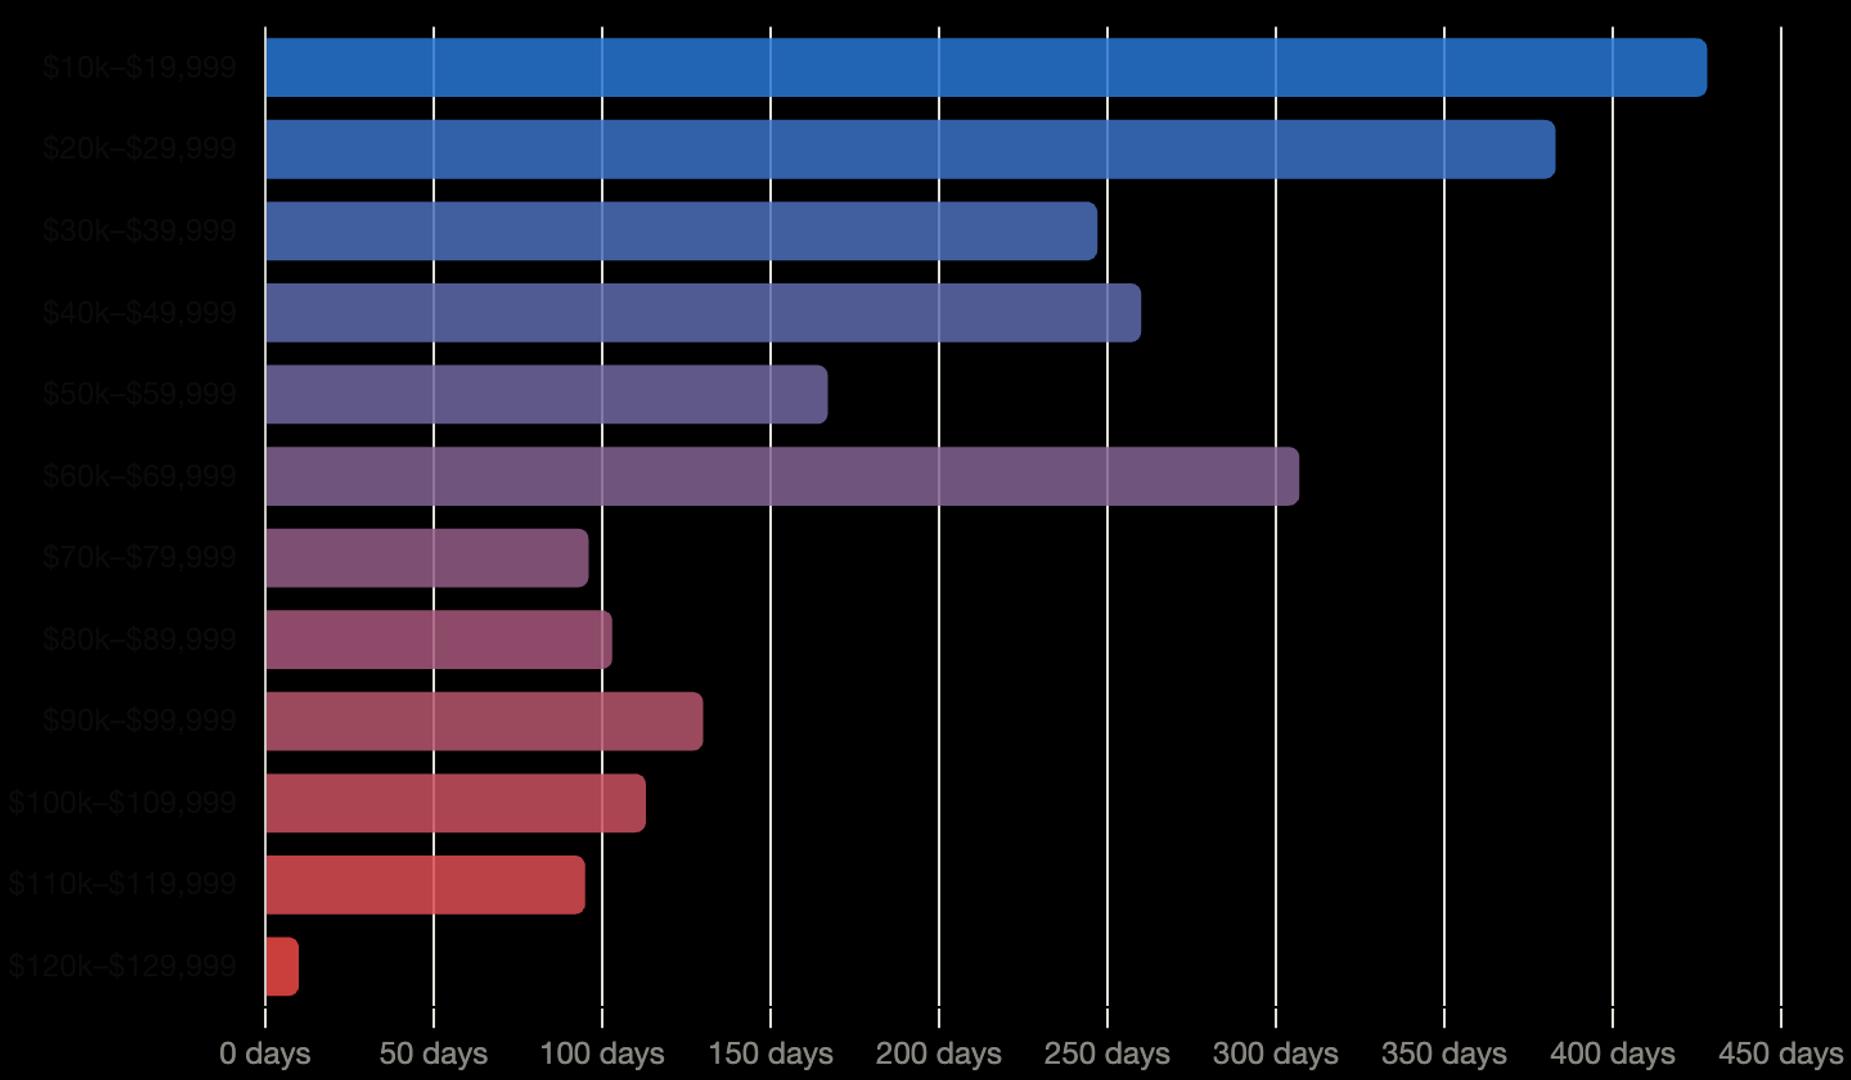
Bitcoin has officially spent 307 days trading within the $60,000 to $70,000 price band, cementing this range as the third longest period of consolidation in the cryptocurrency's entire history.
Bitcoin has spent 307 days trading between $60,000 and $70,000, making it the third longest price consolidation period in the asset's history.
For American investors, this prolonged sideways movement—often called consolidation (moving within a specific range without a clear trend)—might feel like a standoff between buyers and sellers. This behavior is occurring across major US platforms like Coinbase and Kraken as market participants weigh economic data.
Following the highs of early 2024, Bitcoin has repeatedly tested these boundaries. This phase matters because historical data suggests that the longer an asset stays in a narrow range, the more explosive the eventual exit from that range tends to be.
The Significance of the $60,000 to $70,000 Window
In the world of technical analysis (using historical price charts to predict future moves), a $10,000 range is a psychological battleground. By lingering here for over 300 days, Bitcoin has established a high degree of liquidity (the ease with which an asset can be bought or sold without affecting its price).
Investors can track these volume profiles on tools like CoinGecko to see where the most buying pressure exists. Currently, the bulk of trading activity is clustered near the middle of this range, suggesting a temporary equilibrium in the market.
This isn't the first time we've seen such a logjam. Previous long-term ranges occurred during the 2017 and 2021 bull cycles. However, the current duration puts it in the elite company of Bitcoin's most significant historical foundations.
How This Compares to Previous Market Cycles
Bitcoin's journey hasn't always been about rapid moonshots. In fact, many seasoned traders call these periods "the grind." This current 307-day stretch is surpassed only by two other major price windows in terms of duration.
- $0 – $10,000: The longest period, naturally, as Bitcoin grew from an experiment to a financial asset.
- $30,000 – $40,000: A major accumulation zone during the previous market cycles.
- $60,000 – $70,000: Our current phase, representing the new "institutional normal."
"Long periods of sideways action are often the fuel for the next macro leg up; it is the market's way of transferring coins from impatient hands to high-conviction holders."
Defining Support and Resistance
During this time, $60,000 has acted as a support level (a price point where buying is strong enough to stop the price from falling). Conversely, $70,000 has acted as resistance (where selling pressure prevents the price from rising further). Each time Bitcoin hits these levels, it tests the resolve of US retail and institutional investors alike.
Institutional Influence and US Market Dynamics
A primary driver for this stability is the matured landscape of US spot ETFs (Exchange-Traded Funds). These funds allow regular investors to buy Bitcoin through their standard brokerage accounts like Schwab or Fidelity. These products have brought billions of dollars in AUM (Assets Under Management).
- Institutional buying often creates a "floor" that prevents deep price crashes.
- Systematic rebalancing by large funds keeps the price within a predictable lane.
- Increased regulatory clarity in the US encourages long-term holding over short-term speculation.
This "institutionalization" of Bitcoin may be dampening the wild volatility (large price swings) that the asset was once famous for. For a beginner, this might mean a smoother ride, though it requires more patience to see significant gains.
What This Means for USA Investors
For those filing taxes in the United States, this sideways movement has specific implications. The IRS (Internal Revenue Service) treats Bitcoin as property, meaning capital gains taxes are only triggered when you sell or trade your coins for a profit.
Because the price has stayed relatively flat, many investors who bought in the last year may currently be at a "wash" or holding slight unrealized gains (profit on paper that hasn't been locked in). This can be an ideal time to review your portfolio without the stress of rapid price fluctuations.
Additionally, the SEC (Securities and Exchange Commission) and CFTC (Commodity Futures Trading Commission) continue to refine their stance on digital assets. Most US-based exchanges like Coinbase provide detailed reports to help users stay compliant with these evolving federal standards.
Protecting Your Portfolio During Sideways Trends
While the market is range-bound, many intermediate investors turn to DCA (Dollar Cost Averaging). This involves buying a set dollar amount of Bitcoin at regular intervals regardless of the price. In a range-bound market, DCA helps lower your average entry price over time.
It is also a period where altcoins (any cryptocurrency that isn't Bitcoin) might see increased attention. When Bitcoin stays flat, traders often look for higher returns in smaller, more volatile assets. However, Bitcoin remains the "North Star" for the entire US crypto market.
Ultimately, the move beyond $70,000 will likely be driven by US macroeconomic factors, such as interest rate changes by the Federal Reserve or shifts in Treasury yields. Watching the DXY (US Dollar Index) can provide clues, as Bitcoin often moves in the opposite direction of the dollar's strength.
Key Takeaways
- Identify the $60,000 to $70,000 range as a massive institutional support and resistance zone.
- Recognize this as the third-longest period Bitcoin has spent within a $10,000 price window.
- Monitor high-volume trading levels that often precede major 'breakout' or 'breakdown' volatility.
- Understand how long-term holders use these sideways markets to accumulate more BTC coins.
- Evaluate the impact of US spot Bitcoin ETFs on maintaining this specific price stability.