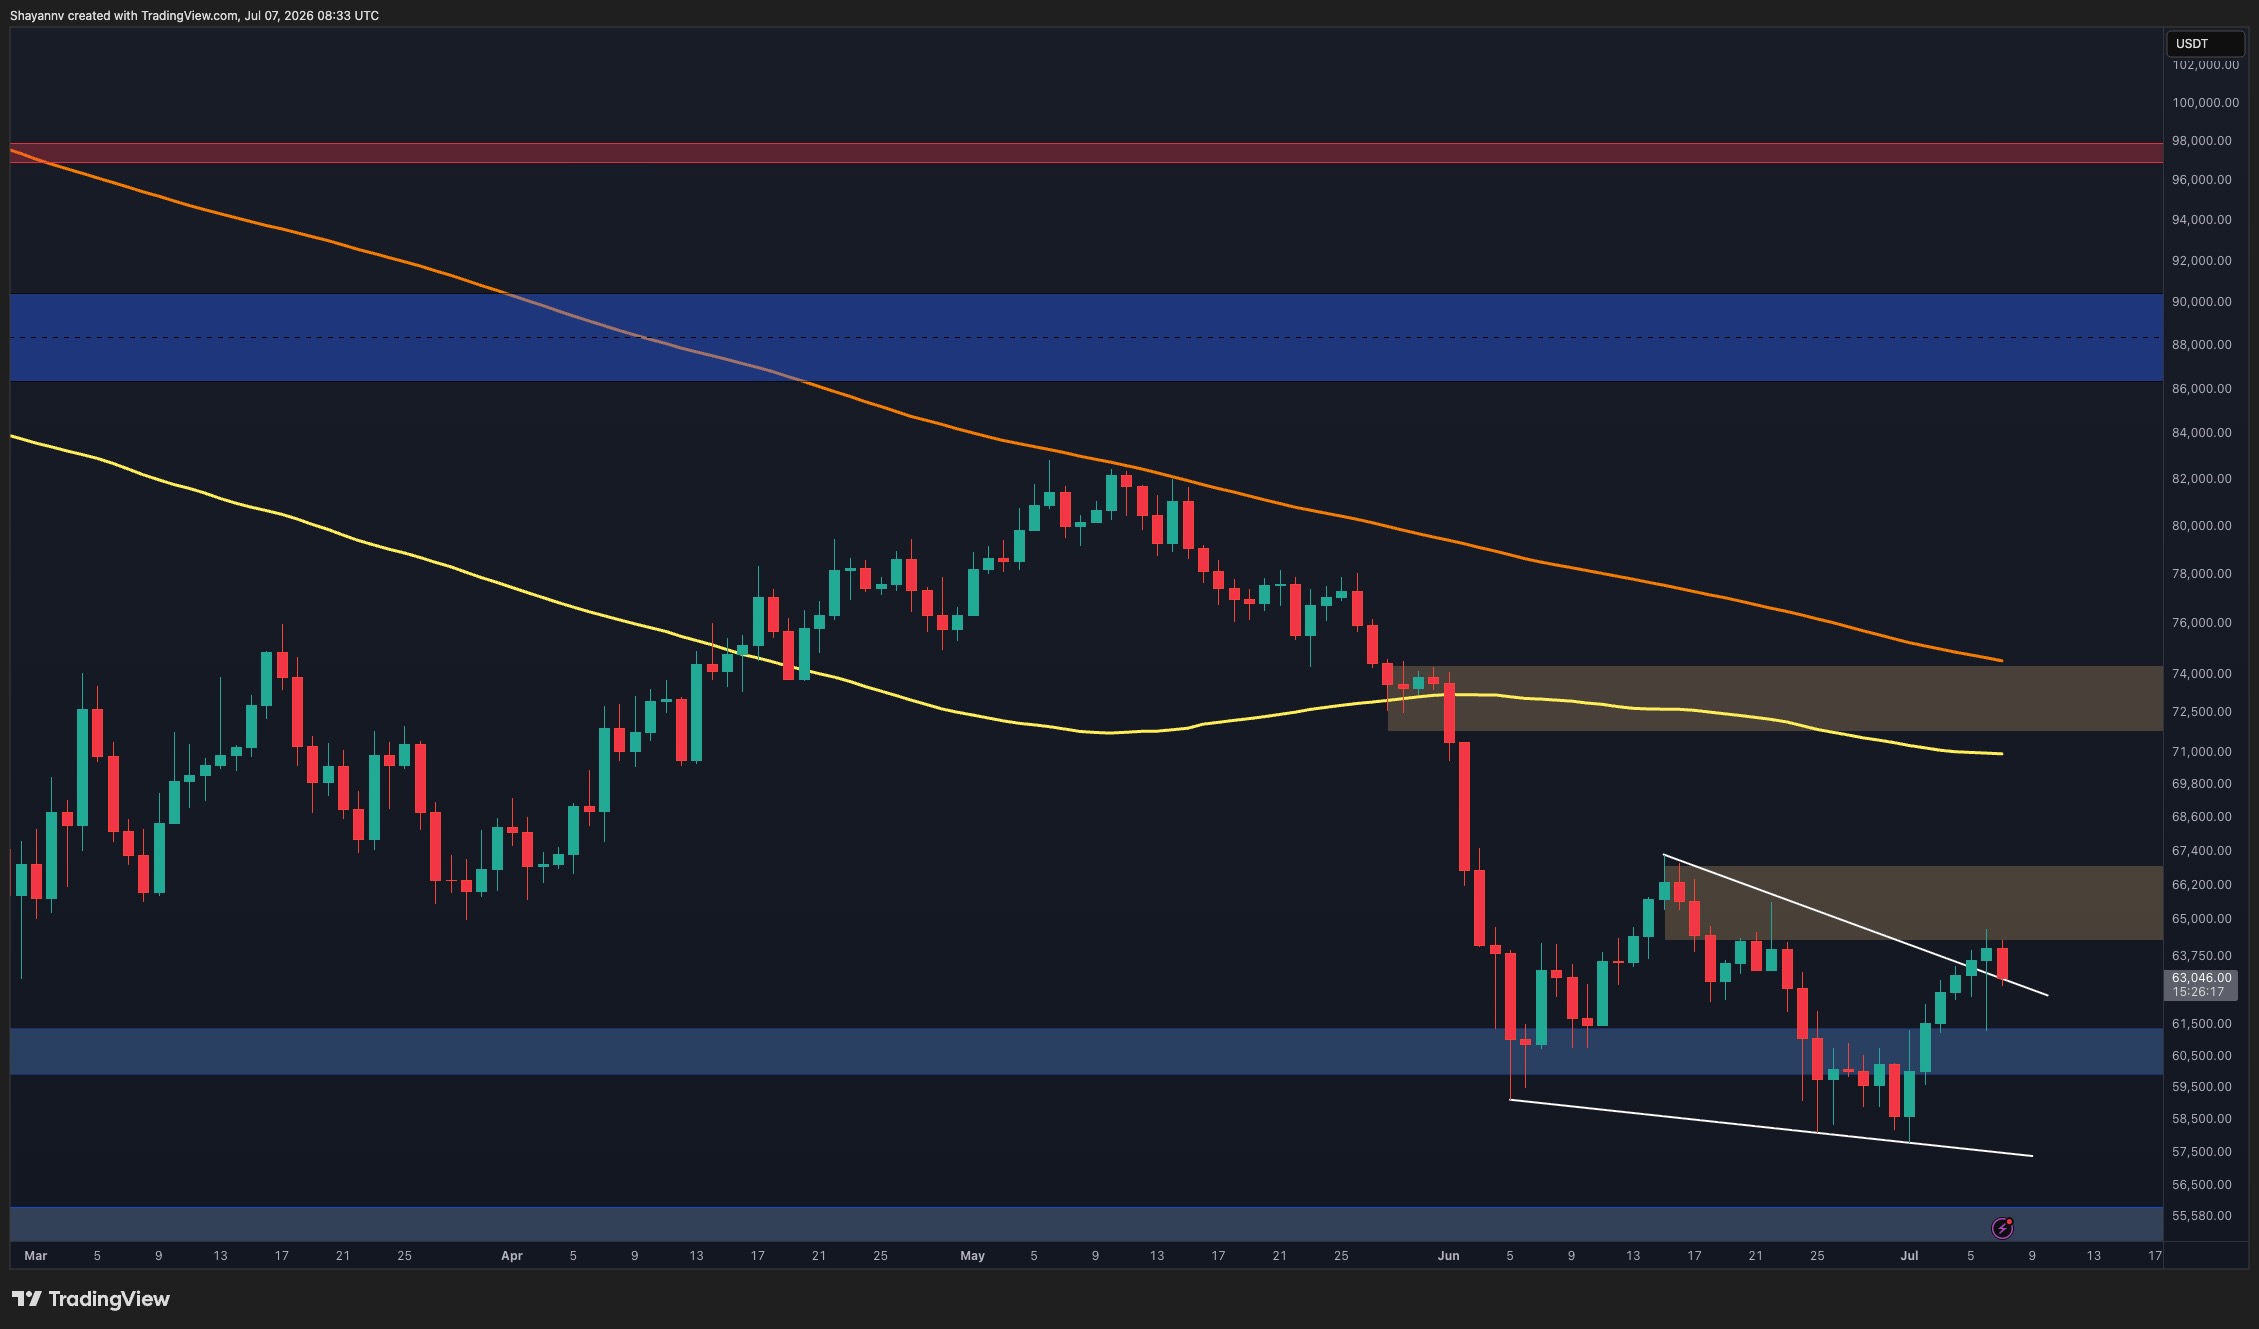
Bitcoin's price structure remains technically bearish until the asset can reclaim and hold above the major resistance level near $65,000.
Bitcoin remains in a bearish technical structure until it consistently closes above major resistance levels near the $65,000 mark. Analysts warn that while relief rallies look promising, a full trend reversal requires reclaiming previous support zones.
Following a volatile summer for the crypto markets, Bitcoin (BTC) is attempting a recovery move across major US exchanges. While daily momentum has turned slightly positive, veteran traders are keeping a close eye on a specific "resistance cluster" (a price zone where selling pressure is high) that has successfully blocked every rally since June. For American investors, this technical wall represents the difference between a minor bounce and a full-scale market recovery.
The Significance of the $65,000 Resistance Level
The current market structure is what analysts call "bearish," meaning the trend of lower highs and lower lows remains intact. Since the breakdown in late June, Bitcoin has struggled to maintain its footing above key psychological levels. To flip the script, BTC needs to flip its current resistance (the price ceiling) back into support (the price floor).
Many investors look at the 200-day Moving Average (a common indicator showing the average price over 200 days) as a litmus test for market health. Currently, Bitcoin is battling to stay efficient near this line. Without a decisive breakout fueled by high trading volume, the risk of another dip toward lower support levels remains elevated for retail holders.
Understanding Market Sentiment and Liquidity
Market sentiment (the overall attitude of investors) has shifted from extreme fear to a state of cautious optimism. However, liquidity—the ease with which Bitcoin can be bought or sold without moving the price—remains thinner than usual on American platforms like Kraken and Gemini. This thin liquidity can lead to "fakeouts," where the price spikes briefly only to crash back down once large sellers enter the fray.
"Bitcoin follows a cycle of consolidation before major moves; the current resistance is the final hurdle before a potential re-test of all-time highs."
Investors should also consider how this fits into the broader ecosystem of Investopedia DeFi explainer and other digital assets. When Bitcoin faces a wall, it often drains liquidity from Altcoins (alternative cryptocurneys besides Bitcoin), as traders move back into the safety of the "King of Crypto."
Indicators to Watch During the Recovery
While price is the most visible metric, several underlying data points will signal whether this recovery has "legs." US investors should track these specific indicators closely:
- Spot ETF Inflows: Track the amount of USD flowing into Bitcoin ETFs managed by BlackRock and Fidelity.
- RSI Levels: The Relative Strength Index (a momentum tool) helps identify if BTC is "overbought" or "oversold."
- Funding Rates: These show whether the majority of traders are betting on higher prices (longs) or lower prices (shorts).
Key Steps for Navigating a Bearish Structure
If you are managing a portfolio during this period of uncertainty, following a disciplined approach is vital. Successful investors often use these steps to mitigate risk:
- Define Your Exit: Know at what price you will sell to protect your capital if the breakdown continues.
- Dollar Cost Averaging: Instead of buying all at once, invest small amounts at set intervals to lower your average cost.
- Verify the Breakout: Wait for a daily candle to close above resistance before assuming the trend has changed.
What This Means for USA Investors
For those filing taxes with the IRS, remember that every trade—including swapping BTC for another coin—is a taxable event based on the USD value at the time of the trade. The SEC (Securities and Exchange Commission) continues to monitor the space closely, meaning regulatory news can cause sudden price swings regardless of technical charts. Currently, most major US-based exchanges like Coinbase and Kraken provide the most reliable price discovery for Bitcoin.
Additionally, the Federal Reserve's stance on interest rates heavily influences Bitcoin's price. When the dollar is strong, Bitcoin often faces headwinds. Because Bitcoin is priced globally in USD, any shift in the DXY (US Dollar Index) will directly impact your portfolio's value in real-time. Keep an eye on domestic inflation reports as they often act as catalysts for Bitcoin price moves.
Key Takeaways
- Identify the major resistance cluster that is currently capping Bitcoin's upward momentum.
- Monitor short-term relief rallies to differentiate between true reversals and 'dead cat bounces.'
- Watch trading volume on US exchanges like Coinbase to confirm buying pressure strength.
- Understand the impact of Federal Reserve policy on current Bitcoin price fluctuations.
- Evaluate the risk of a secondary sell-off if BTC fails to flip resistance into support.