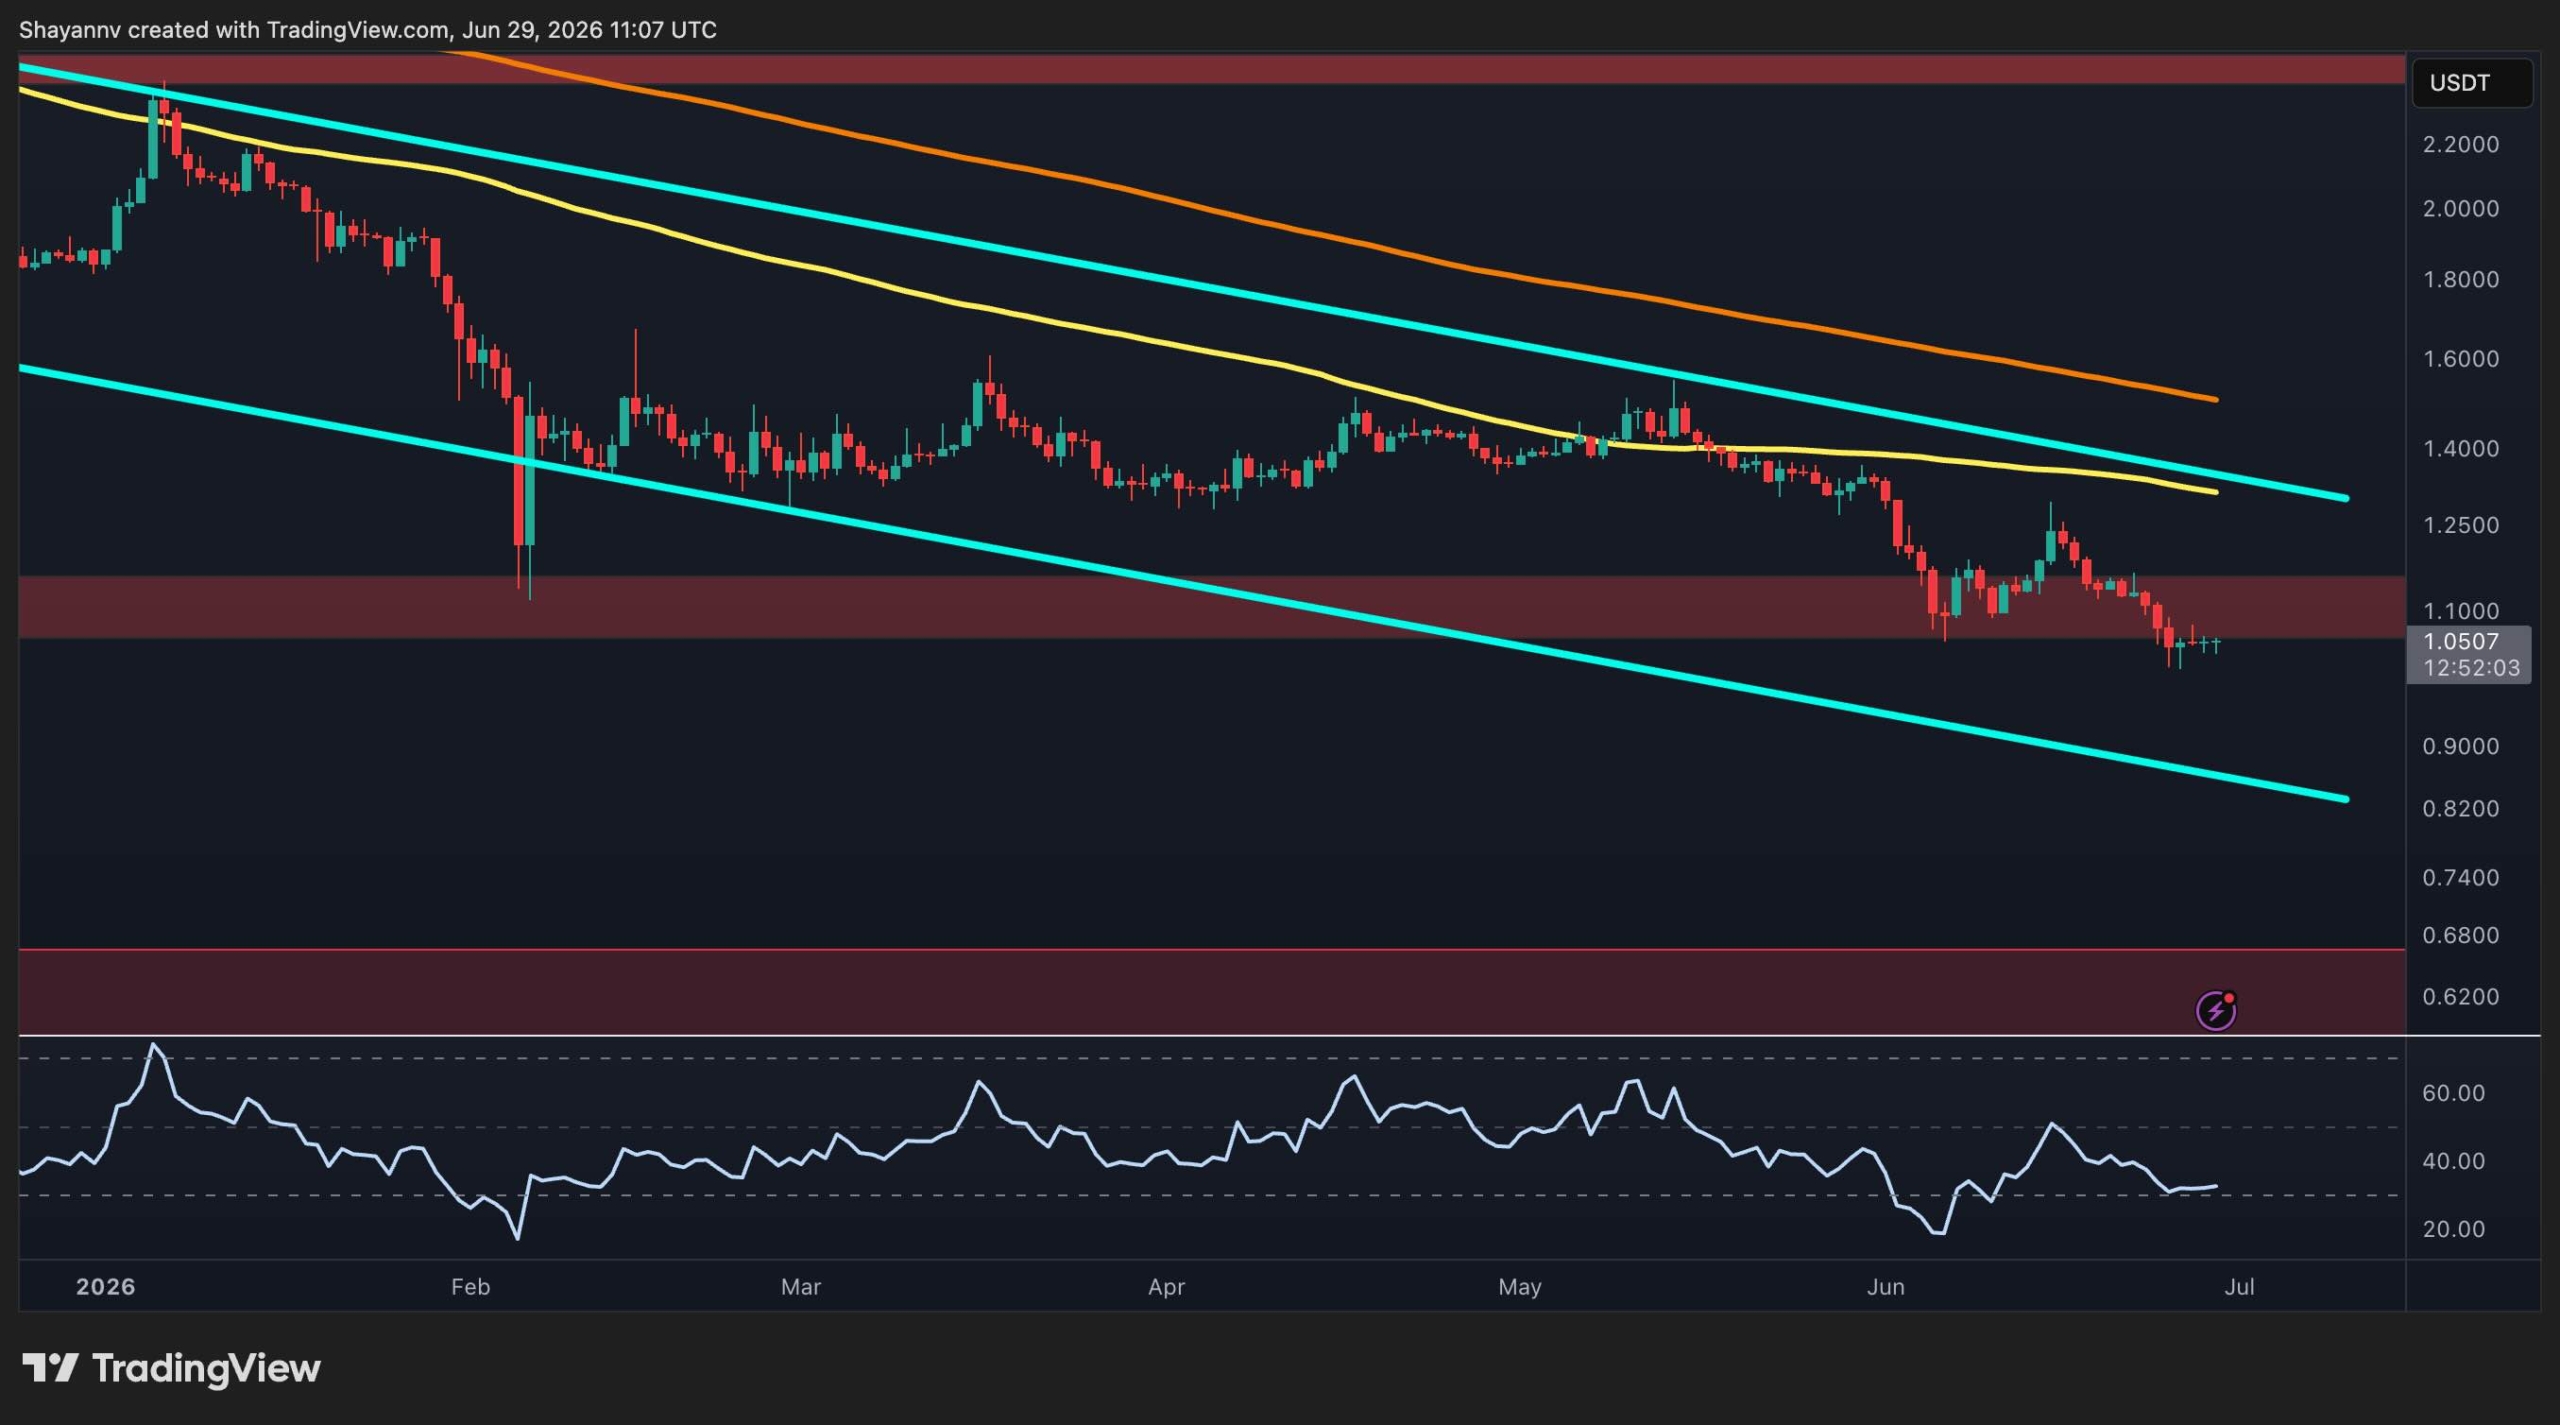
XRP is currently hovering at a high-stakes technical crossroads, testing major demand zones that will determine its price trajectory for the remainder of the quarter.
XRP is currently testing critical support levels against both the US Dollar and Bitcoin, suggesting a major price move is imminent as the market reaches a technical breaking point.
As the broader cryptocurrency market experiences a period of consolidation, XRP (the native token of the Ripple network) is facing intense scrutiny from American retail and institutional traders. The asset is currently trapped within a clear downtrend structure, mirroring the volatility seen across the top digital assets in the US market. Understanding these technical patterns is vital for investors trying to time their entries.
The USDT Pair: Testing the Critical Demand Zone
On the daily chart against the US Dollar Tether (USDT), XRP has been printing a series of lower highs and lower lows. This pattern indicates a sustained downtrend that has pushed the price toward a major demand zone (an area where buying interest typically exceeds selling pressure). For US traders, this zone represents a line in the sand that could spark a relief rally.
If the price fails to hold this support, we could see a rapid descent toward the next psychological level. Conversely, a bounce here would signal that buyers are finally stepping in to absorb the selling pressure. Many analysts are looking at the 200-day moving average (a lagging indicator that reflects the average price over 200 days) as the next major hurdle for a bullish breakout.
XRP vs. Bitcoin: The Battle for Dominance
It is not just the dollar value that matters; the XRP/BTC pair is also at a tipping point. This pair measures how XRP performs relative to Bitcoin. Currently, XRP is hovering just above a multi-year support level against BTC. If it drops below this point, it could signal that Bitcoin will continue to outperform the altcoin market.
However, historically, when XRP hits these lows against Bitcoin, a sharp "mean reversion" (a theory that prices eventually move back to their average) often follows. US investors often use this ratio to decide whether to rotate their capital out of Bitcoin and into Ripple's token for higher potential short-term gains.
Technical Indicators Point to Extreme Tension
Several technical tools suggest that a "squeeze" is coming. When volatility remains low for an extended period, it often precedes a massive price expansion. Traders are closely watching these three metrics:
- Relative Strength Index (RSI): A momentum tool that shows if an asset is oversold or overbought. Currently, XRP is nearing oversold territory.
- Trading Volume: Declining volume suggests that sellers are exhausted, but buyers haven't yet taken full control.
- Bollinger Bands: These bands are tightening, which historically signals an impending "storm" of price action.
"The technical setup for XRP reflects a classic wait-and-see approach from the market, where the next 10% move will likely dictate the trend for the next three months."
Understanding the Role of Decentralized Finance
While technical analysis focuses on charts, the underlying utility of XRP in the ecosystem cannot be ignored. Much of the long-term value for XRP is tied to its integration into financial systems and the growing world of Investopedia DeFi explainer, which describes how blockchain replaces traditional intermediaries. As Ripple expands its Ledger (XRPL) capabilities, its role in this new financial stack becomes more relevant to US-based developers and investors.
What This Means for USA Investors
For investors based in the United States, XRP remains a unique case due to the regulatory climate. While Ripple has achieved significant legal victories against the SEC, the asset's tax treatment remains consistent with other cryptocurrencies. You must report any capital gains or losses on Form 8949 when filing your federal taxes with the IRS.
Currently, XRP is widely available for US residents on major platforms like Coinbase, Kraken, and Gemini. However, the price is heavily influenced by Western macro data, such as Federal Reserve interest rate decisions. Steps for US investors to consider include:
- Reviewing Exchange Liquidity: Ensure your chosen US exchange has deep enough liquidity to handle volatile price swings.
- Setting Stop-Losses: Protect your USD capital by placing sell orders below the current demand zone.
- Consulting Tax Software: Use tools that sync with US exchanges to track your XRP cost basis automatically.
Ultimately, the current "calm" in the XRP price is likely temporary. Whether the next move is a breakdown or a breakout, the current price levels offer a definitive entry or exit signal for disciplined investors.
Key Takeaways
- Monitor the $0.50 support level as a key psychological and technical floor for XRP in the short term.
- Watch the XRP/BTC trading pair for signs of institutional rotation away from Bitcoin into altcoins.
- Evaluate the impact of ongoing SEC litigation on Ripple's ability to maintain liquidity on US exchanges.
- Identify potential upside targets near the 200-day moving average if a bullish reversal occurs.