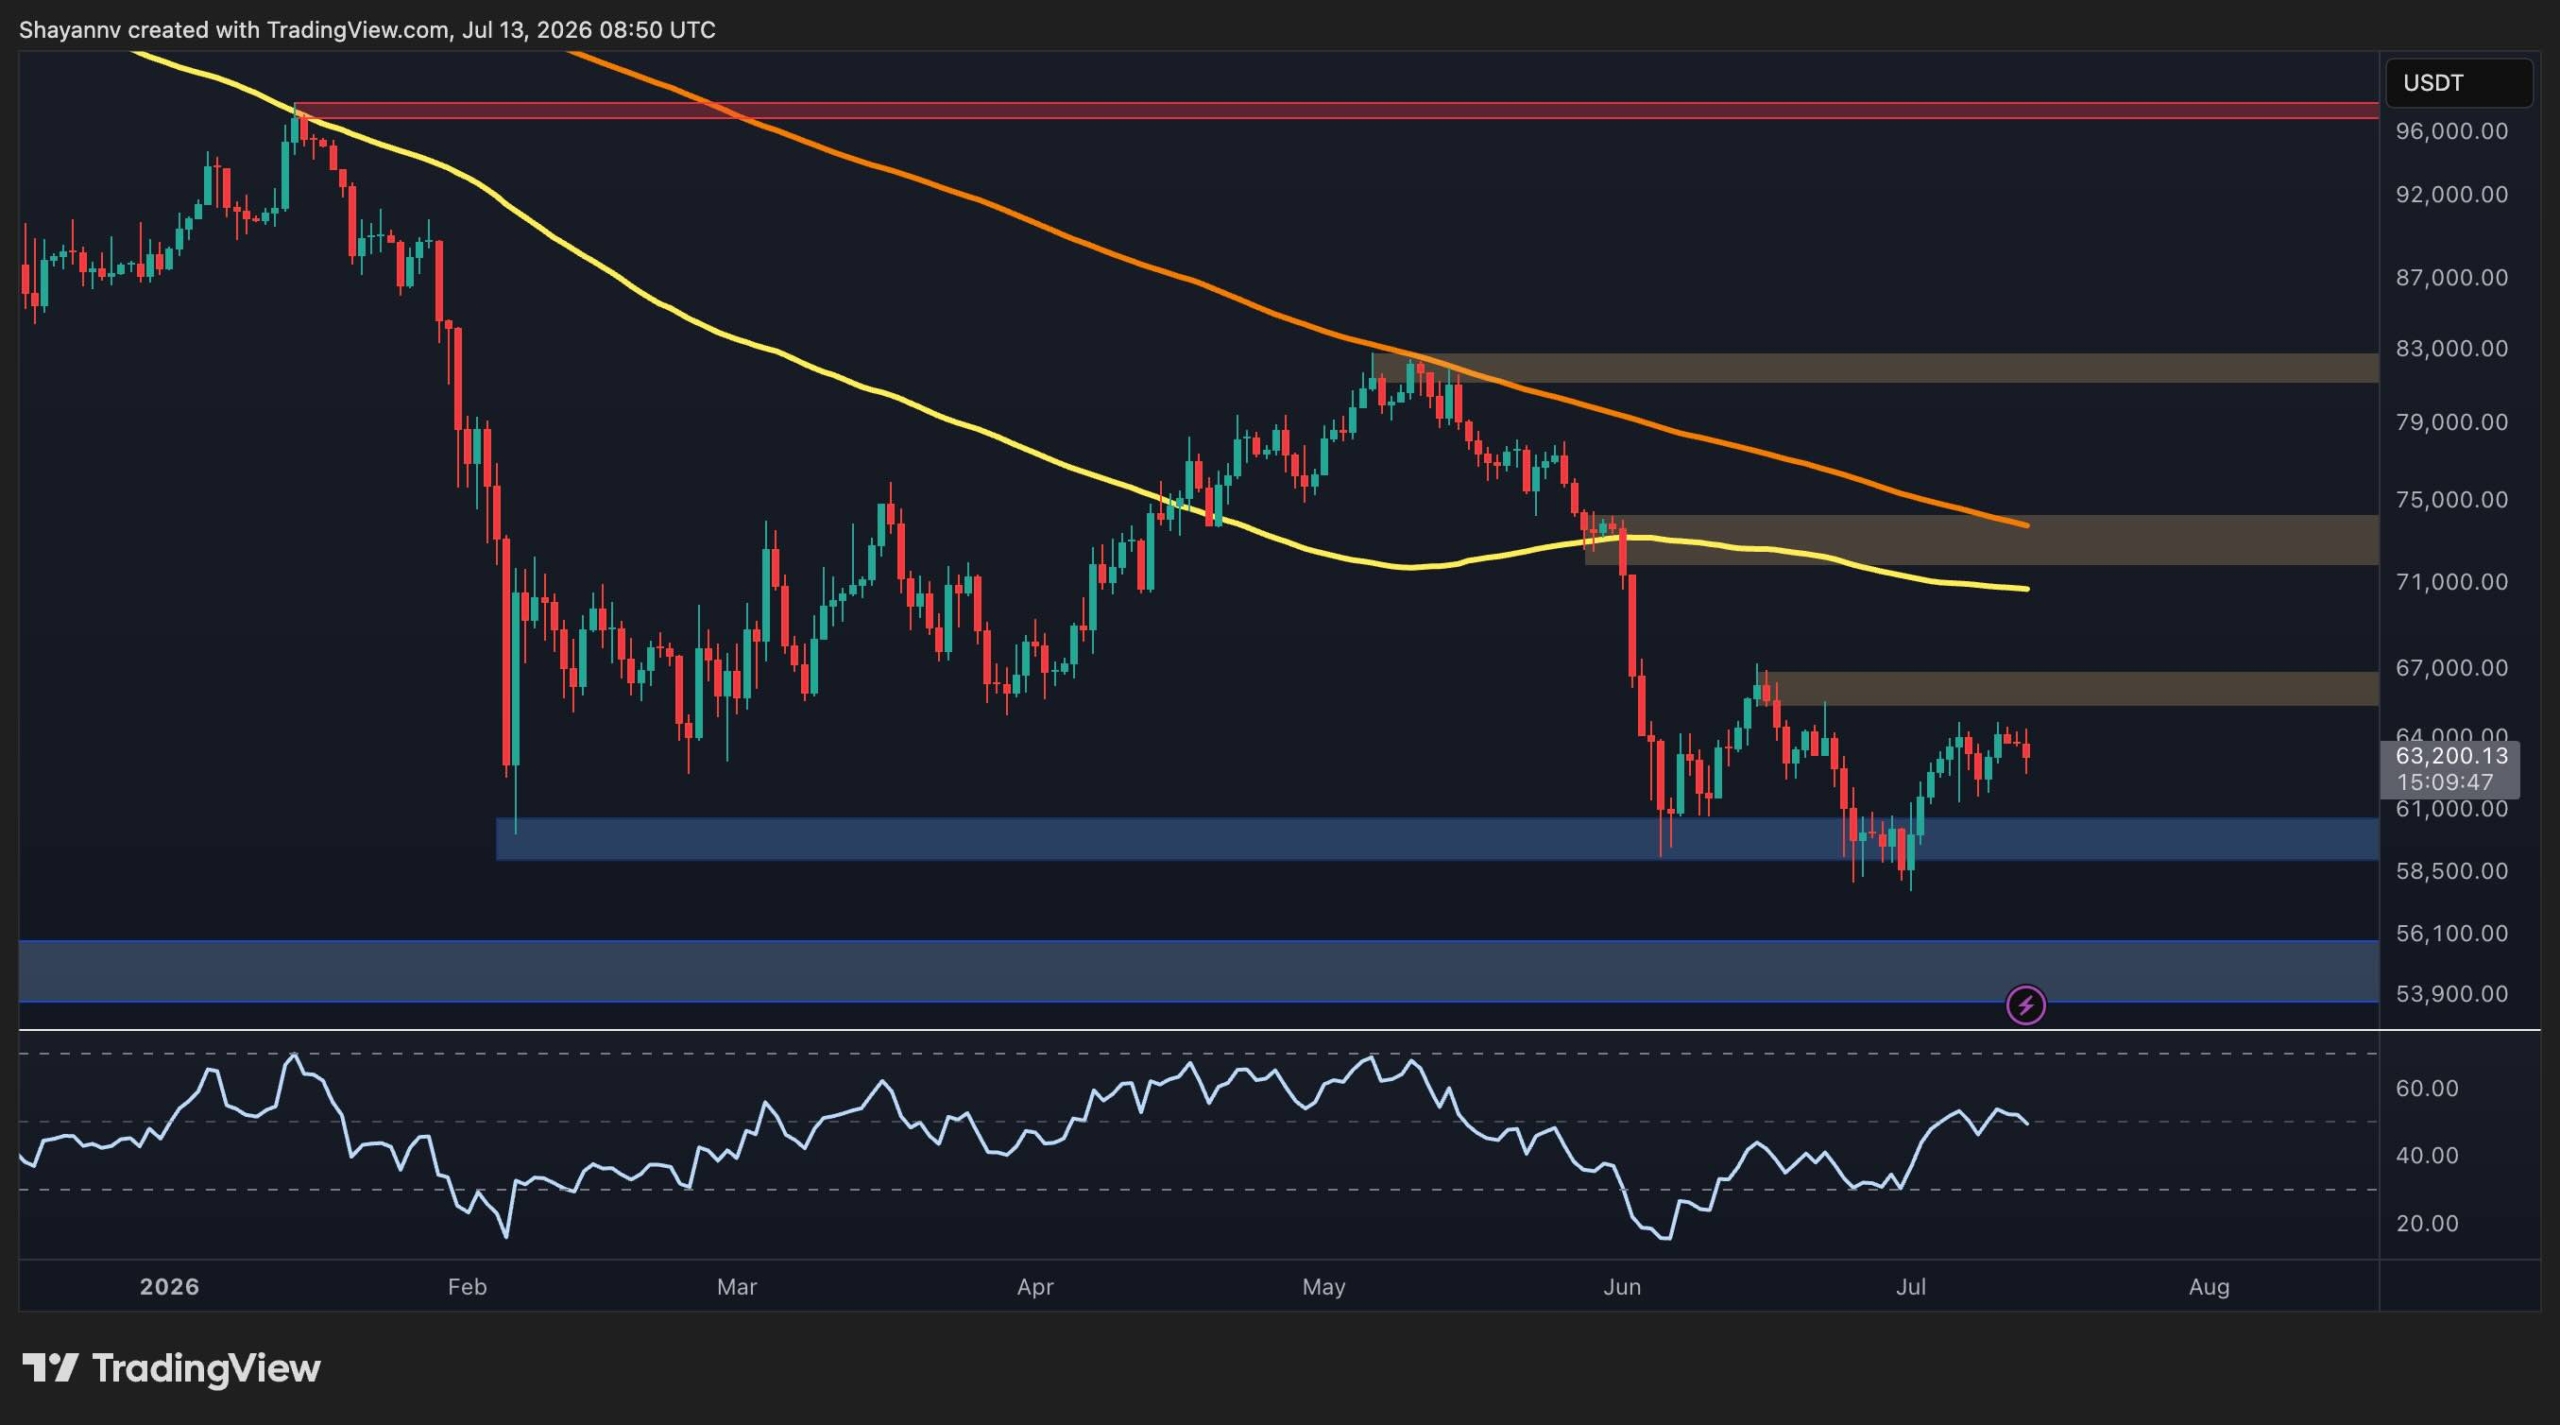
The current Bitcoin price pullback appears to be a healthy market correction that could provide a strategic entry point for long-term investors as seller exhaustion sets in.
The recent Bitcoin pullback suggests a temporary cooling off that may actually set the stage for a long-term bullish continuation as selling pressure begins to fade.
Bitcoin (BTC) is currently navigating a period of price consolidation after a significant rejection from the mid-$80,000 range. For American investors, this movement represents a critical test of market resilience following the massive influx of capital into spot ETFs earlier this year. While the short-term chart looks choppy, the underlying data suggests that the aggressive selling seen in late spring is finally starting to taper off.
Understanding the Recent Price Correction
Bitcoin's journey toward the $100,000 milestone hit a speed bump when prices retreated from local highs. This pullback (a temporary drop in price during an upward trend) has left many retail traders wondering if the bull run is over. However, historical data shows that major rallies often require these "breather" periods to shake out weak hands and reset technical indicators.
Currently, the market is finding support as it stabilizes. Analysts are tracking momentum (the speed of price changes) to see if buyers are ready to step back in. If the price manages to hold steady above key psychological levels, the recent dip may be remembered as a classic "buy the rumor" opportunity before the next leg up.
Derivatives Data Shifts to Bullish
One of the most encouraging signs for BTC bulls isn't found on the price chart, but in the derivatives market (financial contracts like futures that stay connected to Bitcoin's price). Specifically, funding rates have stabilized. Funding rates are periodic payments made between traders to keep the price of futures contracts aligned with the actual spot price of Bitcoin.
- Positive Funding Rates: This indicates that long-position traders are paying shorts, suggesting a bullish bias.
- Reduced Volatility: A steady rate suggests the market is not overly leveraged.
- Institutional Interest: Consistent activity in CME futures points to ongoing professional engagement.
"While spot prices tell the story of today, the derivatives market often provides a roadmap for where the smart money believes Bitcoin is headed tomorrow."
Technical Support and Resistance Levels
To understand where Bitcoin is going, we must look at support (a price level where a downtrend tends to pause due to a concentration of demand) and resistance (where an uptrend pauses due to selling pressure). The mid-$80,000 zone has proven to be a formidable ceiling that Bitcoin must crack to regain its upward trajectory.
On the downside, investors are watching for a clear floor. As selling momentum slows, the chances of a reversal (a change in the direction of a price trend) increase. Many investors use this Investopedia DeFi explainer to understand how decentralized protocols might also influence liquidity during these volatile periods.
Strategic Steps for Navigating Volatility
When the market experiences a pullback, experienced investors often follow a disciplined checklist. Staying calm during a 10% or 20% drop is often what separates successful holders from those who sell at a loss.
- Verify the trend: Look at the 200-day moving average to see if the long-term path is still up.
- Check the news: Ensure the drop isn't caused by a fundamental flaw in the Bitcoin network.
- Dollar Cost Average (DCA): Consider buying small amounts at regular intervals rather than all at once.
- Set price alerts: Avoid checking the app every five minutes to reduce emotional stress.
What This Means for USA Investors
For those filing taxes in the United States, it is vital to remember that the IRS views Bitcoin as property. Any capital gains (profits from selling an asset) are taxable. Trading during a pullback to "rebalance" your portfolio can trigger a taxable event, so many US investors prefer a "HODL" (Hold On for Dear Life) strategy to qualify for long-term capital gains rates.
Furthermore, the availability of Bitcoin on major US exchanges like Coinbase, Kraken, and Gemini makes it easier to respond to these price dips quickly. With the SEC (Securities and Exchange Commission) having approved spot ETFs, the Bitcoin market has become more institutionalized. This means price swings may be less extreme than in previous years, but the USD price context remains highly sensitive to Federal Reserve interest rate decisions.
Looking Ahead: The Bull Case
While the broader trend on higher timeframes remains cautious, the easing of seller pressure is a foundational step for a recovery. If the US economy shows signs of stabilizing and the Fed hints at rate cuts, Bitcoin could see a massive influx of liquidity that pushes it past previous resistance.
In summary, while pullbacks are stressful, they are a natural part of the Bitcoin lifecycle. For the intermediate investor, these moments offer a chance to zoom out and assess the long-term value of the asset rather than reacting to daily noise.
Key Takeaways
- Monitor the mid-$80k resistance level as a primary hurdle for a definitive bullish breakout.
- Analyze funding rates in the derivatives market to gauge shifts in professional trader sentiment.
- Observe decreasing seller momentum which indicates a potential price floor is forming for Bitcoin.
- Evaluate long-term technical indicators that suggest the broader uptrend remains intact despite volatility.
- Consider the impact of US spot Bitcoin ETFs on liquidity and price stability during recent retracements.