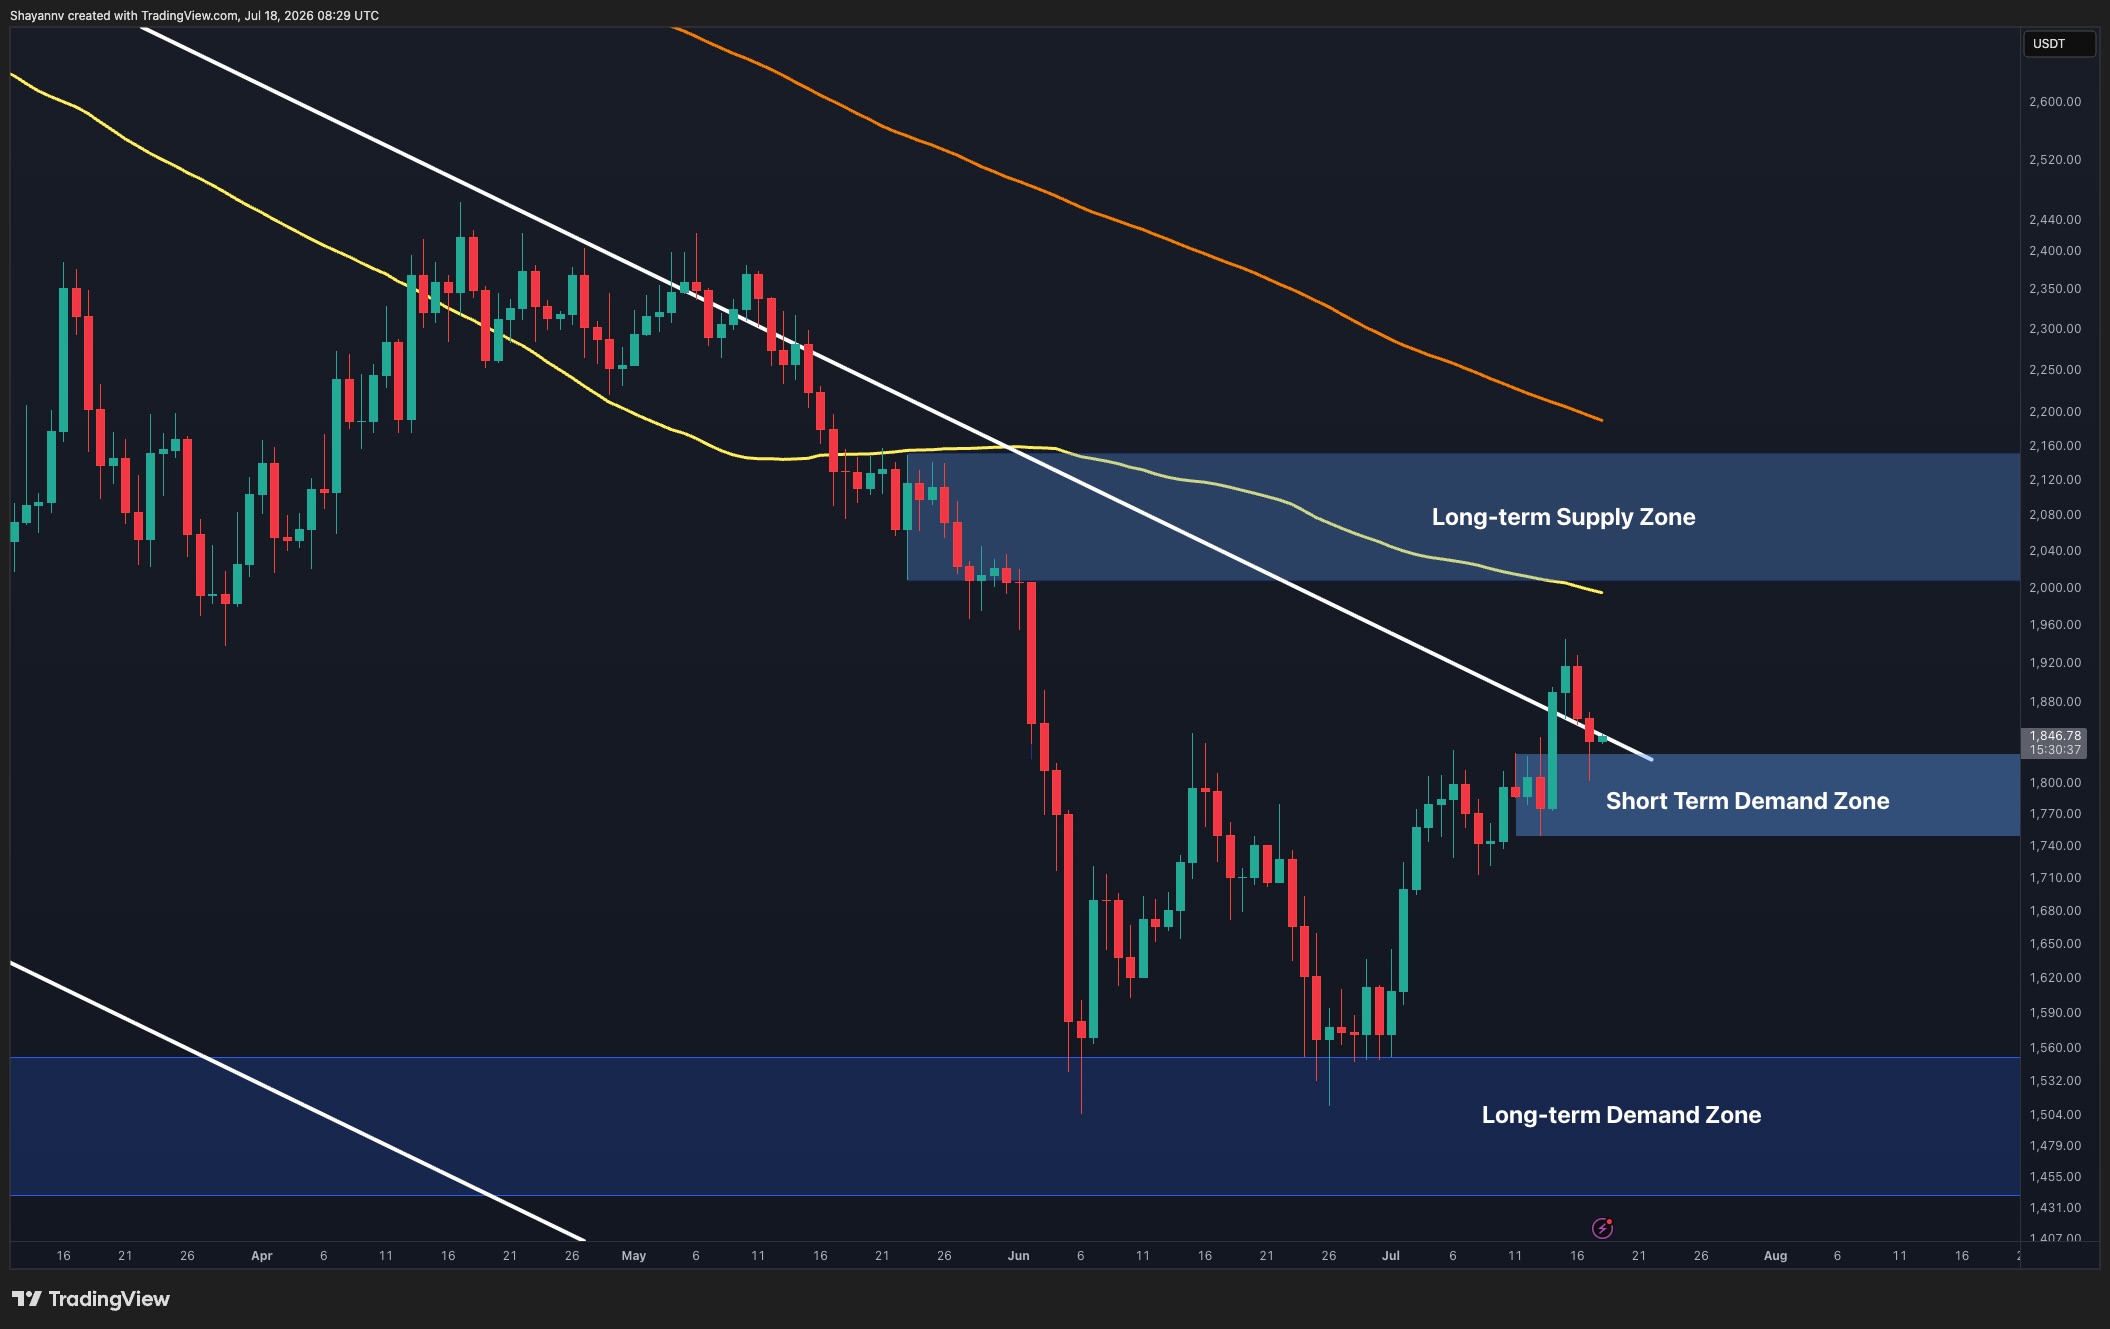
Ethereum is currently battling to maintain its footing above key support levels, keeping the dream of a $2,000 price target alive for US investors and traders.
Ethereum is currently defending a critical support zone that could determine if the asset rallies toward the $2,000 psychological milestone or faces a deeper correction.
After a significant recovery from its June lows, the world’s second-largest cryptocurrency is facing a moment of truth. Following a brief rejection at local highs, Ethereum (ETH) has settled into a tight trading range. This consolidation period is happening right now across major US exchanges like Coinbase and Kraken, as market participants weigh whether the next move is up or down. For American investors, this technical setup represents a high-stakes crossroads for their digital portfolios.
The Battle for the $2,000 Psychological Level
The $2,000 mark is more than just a number; it is a significant psychological level where many sellers tend to congregate. Ethereum has struggled to stay above this line consistently over the past several months. This area acts as a "resistance cluster" (a price zone where selling pressure historically outweighs buying pressure). If ETH can break through this ceiling, it could trigger a wave of FOMO (fear of missing out) among retail investors.
Technical analysts are watching the 200-day moving average (an indicator showing the average price over the last 200 days). This line often serves as a barometer for the overall market trend. Currently, ETH is hovering near a decision point that will likely dictate the price action for the remainder of the quarter. US traders are keeping a close eye on volume to see if a breakout has the legs to stick.
Understanding Key Support Zones
To understand where Ethereum is going, we must look at where it has been. A "support zone" is a price level where a downtrend tends to pause due to a concentration of demand. Ethereum is currently leaning on several technical pillars to prevent a further slide. If these levels hold, it creates a "double bottom" (a bullish chart pattern that suggests a reversal is coming).
- Strong Demand: Significant buying interest is visible near the previous June lows.
- Relative Strength: The RSI (Relative Strength Index), which measures the speed and change of price moves, shows Ethereum is not yet "oversold."
- Institutional Holding: Large-scale US investors appear to be holding their positions rather than panic selling.
"The resilience of Ethereum at these levels suggests that the long-term investment thesis remains intact for many, despite short-term volatility in the broader economy."
The Role of DeFi and Network Utility
Ethereum's value isn't just based on speculation; it is driven by its utility in Investopedia DeFi explainer. Decentralized Finance (DeFi) refers to financial services like lending or trading that operate on a blockchain (a digital, decentralized ledger) without traditional banks. As more US-based developers build on the Ethereum network, the demand for ETH to pay for "gas fees" (transaction costs) increases.
Despite the rise of competitors, Ethereum remains the dominant platform for smart contracts (self-executing contracts with the terms directly written into code). This fundamental strength provides a "floor" for the price. Even when the market is neutral, the constant burn of ETH through transaction fees helps reduce the total supply, potentially helping the price over time through scarcity.
What This Means for USA Investors
For those trading in the United States, the current Ethereum price action has specific implications. The IRS (Internal Revenue Service) treats cryptocurrency as property, meaning every trade or sale is a taxable event. If ETH rallies to $2,000, investors may face significant capital gains taxes if they choose to sell. It is essential to track your "cost basis" (the original value of the asset) to accurately report gains or losses.
- SEC Oversight: The SEC (Securities and Exchange Commission) continues to debate whether ETH is a security or a commodity, which impacts how US exchanges list the token.
- USD Relative Strength: Because ETH is primarily traded against the US Dollar (USD), a strong dollar can sometimes weigh on the crypto's price.
- Platform Security: Stick to regulated US exchanges like Gemini or Coinbase to ensure your funds are protected by standard US financial compliance rules.
Potential Bull and Bear Case Scenarios
The bullish (optimistic) case for Ethereum relies on a successful defense of current support followed by a high-volume break above $1,850. This would clear the path for a run toward $2,000. Conversely, the bearish (pessimistic) case involves a breakdown below current levels, which could send ETH back to test the $1,500 range. For the average investor, this suggests a strategy of "dollar-cost averaging" (investing a fixed dollar amount at regular intervals) to mitigate the risks of timing the market perfectly.
Final Outlook for Ethereum
The technical indicators are currently at a stalemate. While the $2,000 dream is very much on the table, it requires a definitive move from buyers to seize control. Until then, Ethereum is likely to remain in a choppy range. US investors should keep an eye on macro-economic data, such as inflation reports, which often influence how much risk traders are willing to take on digital assets like ETH.
Key Takeaways
- Pinpoint the $2,000 price target as the major psychological and technical resistance for ETH bulls.
- Monitor the current support zone which prevents Ethereum from sliding back toward June lows.
- Evaluate the 'decision point' where technical indicators suggest a volatility breakout is imminent.
- Consider the impact of US-based institutional flows and exchange liquidity on price stability.