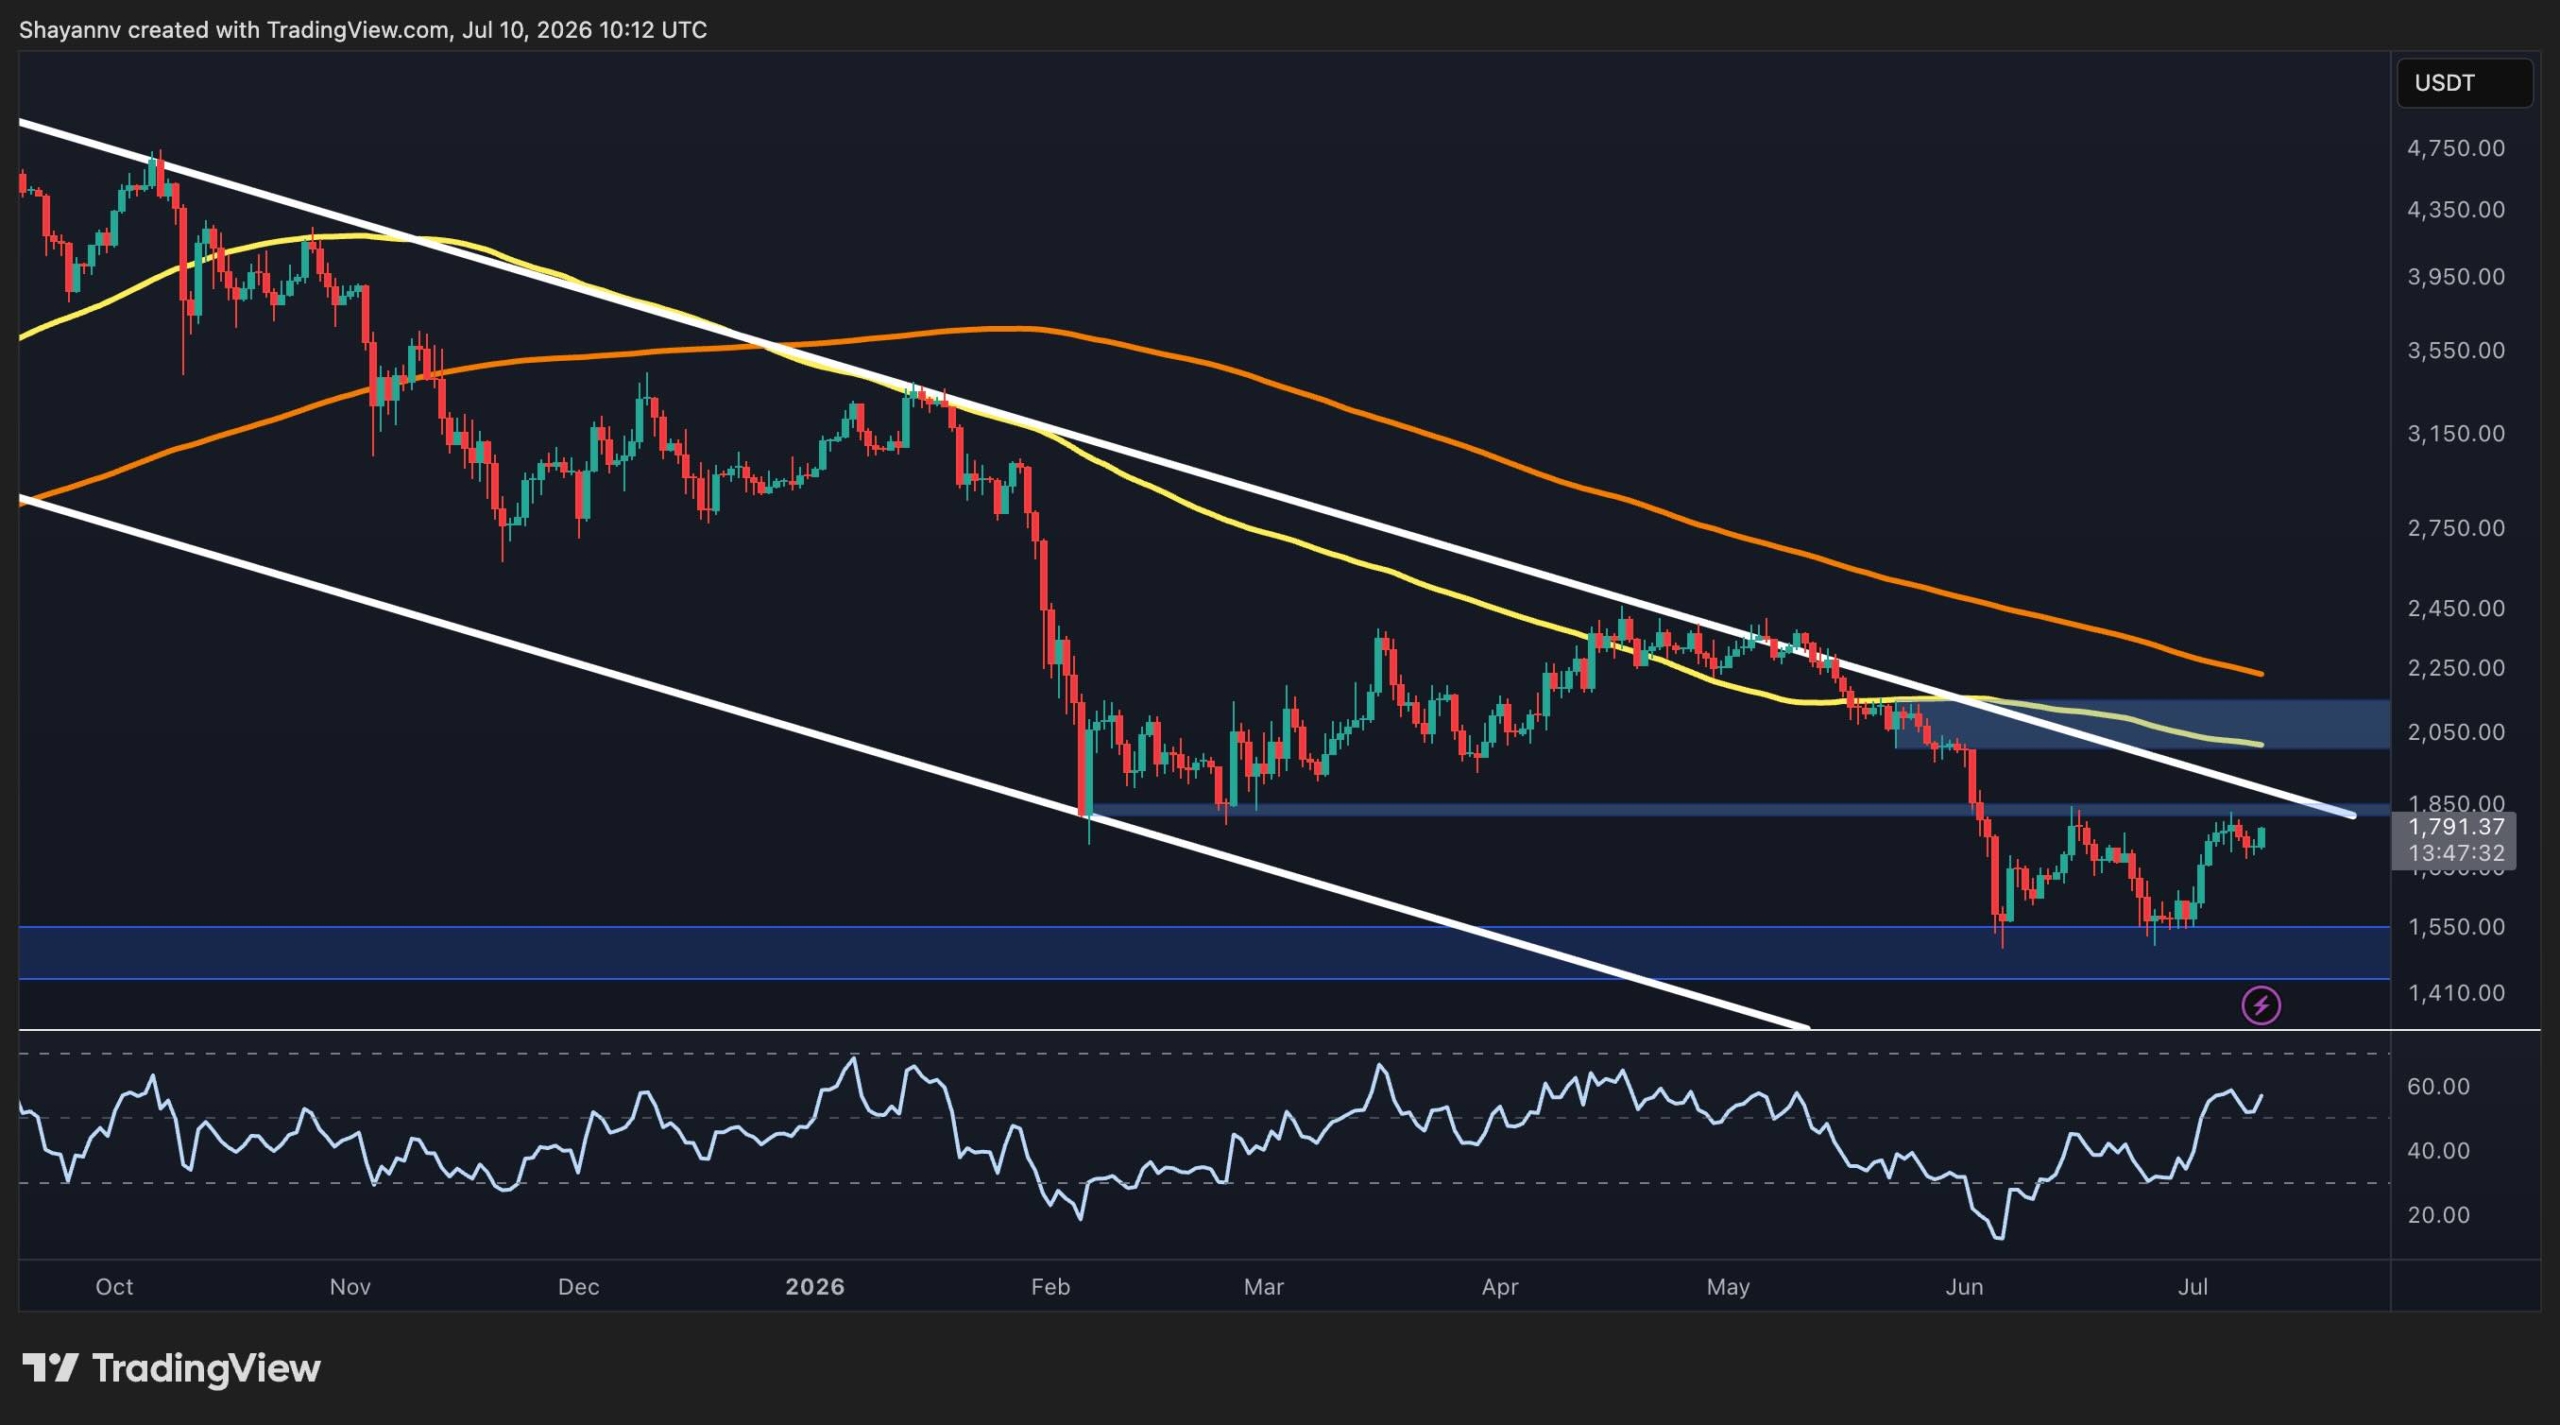
Ethereum is currently facing a pivotal technical test as it attempts to break through long-standing resistance levels following a successful defense of its recent price floor.
Ethereum is currently testing major resistance levels following a recent price floor defense, signaling a possible trend shift if buyer momentum holds. While long-term charts remain cautious, improving on-chain data suggests a stabilizing environment for the world's largest smart contract platform.
After months of sluggish performance, the second-largest cryptocurrency by market cap is showing signs of life. Buyers in the United States and global markets have stepped in to prevent a deeper slide, creating a foundation for a potential recovery. This shift matters because Ethereum serves as the backbone for the broader crypto ecosystem.
Understanding the Ethereum Price Floor
For several weeks, Ethereum (ETH) struggled to find its footing as investors weighed macroeconomic concerns. However, a clear support level (a price where buying interest is strong enough to stop a decline) has emerged. This "bottoming" process suggests that the selling pressure from the past quarter may be exhausting itself.
Technically, the higher time frames still look challenging. Long-term resistance remains a hurdle, but the lower time frame structure—the price action seen on hourly and daily charts—has turned more optimistic. This often precedes a larger breakout if the broader market remains stable.
On-Chain Activity and Network Health
A significant factor in this rebound is the stabilization of on-chain activity. This term refers to the volume of transactions and smart contract (programmable self-executing contracts) interactions occurring directly on the blockchain. After months of cooling participation, data indicates users are returning to the network.
Increased activity is usually a precursor to price appreciation. As more people use Decentralized Finance (DeFi) applications, they must pay fees in ETH, creating natural demand. For a deeper look at these mechanics, you can read this Investopedia DeFi explainer.
"The resilience of Ethereum’s network utility, even during price downturns, highlights its unique position as a productive asset rather than just a speculative token."
Critical Resistance Levels to Watch
While the recovery is encouraging, ETH is not yet in the clear. Traders are closely monitoring specific price targets where selling pressure historically increases. If Ethereum can sustain its momentum, it may target the following zones:
- The $2,650 Level: A short-term hurdle that must be flipped into support.
- The $2,800 Zone: A psychological barrier that has rejected price rallies in the recent past.
- The 200-Day Moving Average: A key technical indicator used to determine the long-term trend direction.
The Daily Chart Technical Outlook
The daily chart exhibits a series of "higher lows," which is a classic bullish (upward trending) signal. This pattern suggests that every time the price dips, buyers are willing to step in at a higher price than they did previously. This building pressure often leads to a volatility spike.
- Identify the support zone near recent lows to manage risk.
- Verify volume spikes during upward moves to confirm buyer strength.
- Wait for a daily candle close above resistance to confirm a breakout.
What This Means for USA Investors
For American investors, the Ethereum outlook is tied closely to local regulatory and tax environments. The Internal Revenue Service (IRS) treats Ethereum as property, meaning any gains from this rebound will be subject to capital gains taxes once realized.
Additionally, the Securities and Exchange Commission (SEC) continues to provide guidance on Ethereum's status, which impact its availability on US-based exchanges like Coinbase, Kraken, and Gemini. Institutional demand via US-listed Spot Ethereum ETFs (Exchange Traded Funds) also plays a massive role in current price stability.
As the USD price fluctuates, US investors should remain mindful of the CFTC’s stance on Ethereum as a commodity, which provides some level of regulatory clarity compared to smaller altcoins. Always ensure you are using regulated platforms to mitigate counterparty risk in the volatile crypto market.
Key Takeaways
- Identify $2,800 as the immediate psychological resistance level for Ethereum bulls to overcome.
- Monitor increasing network participation as a sign that the cooling period for On-chain activity is ending.
- Evaluate the daily chart structure which shows a shift toward a higher-low pattern in the short term.
- Watch for SEC regulatory signals which continue to influence US-based institutional Ethereum demand.