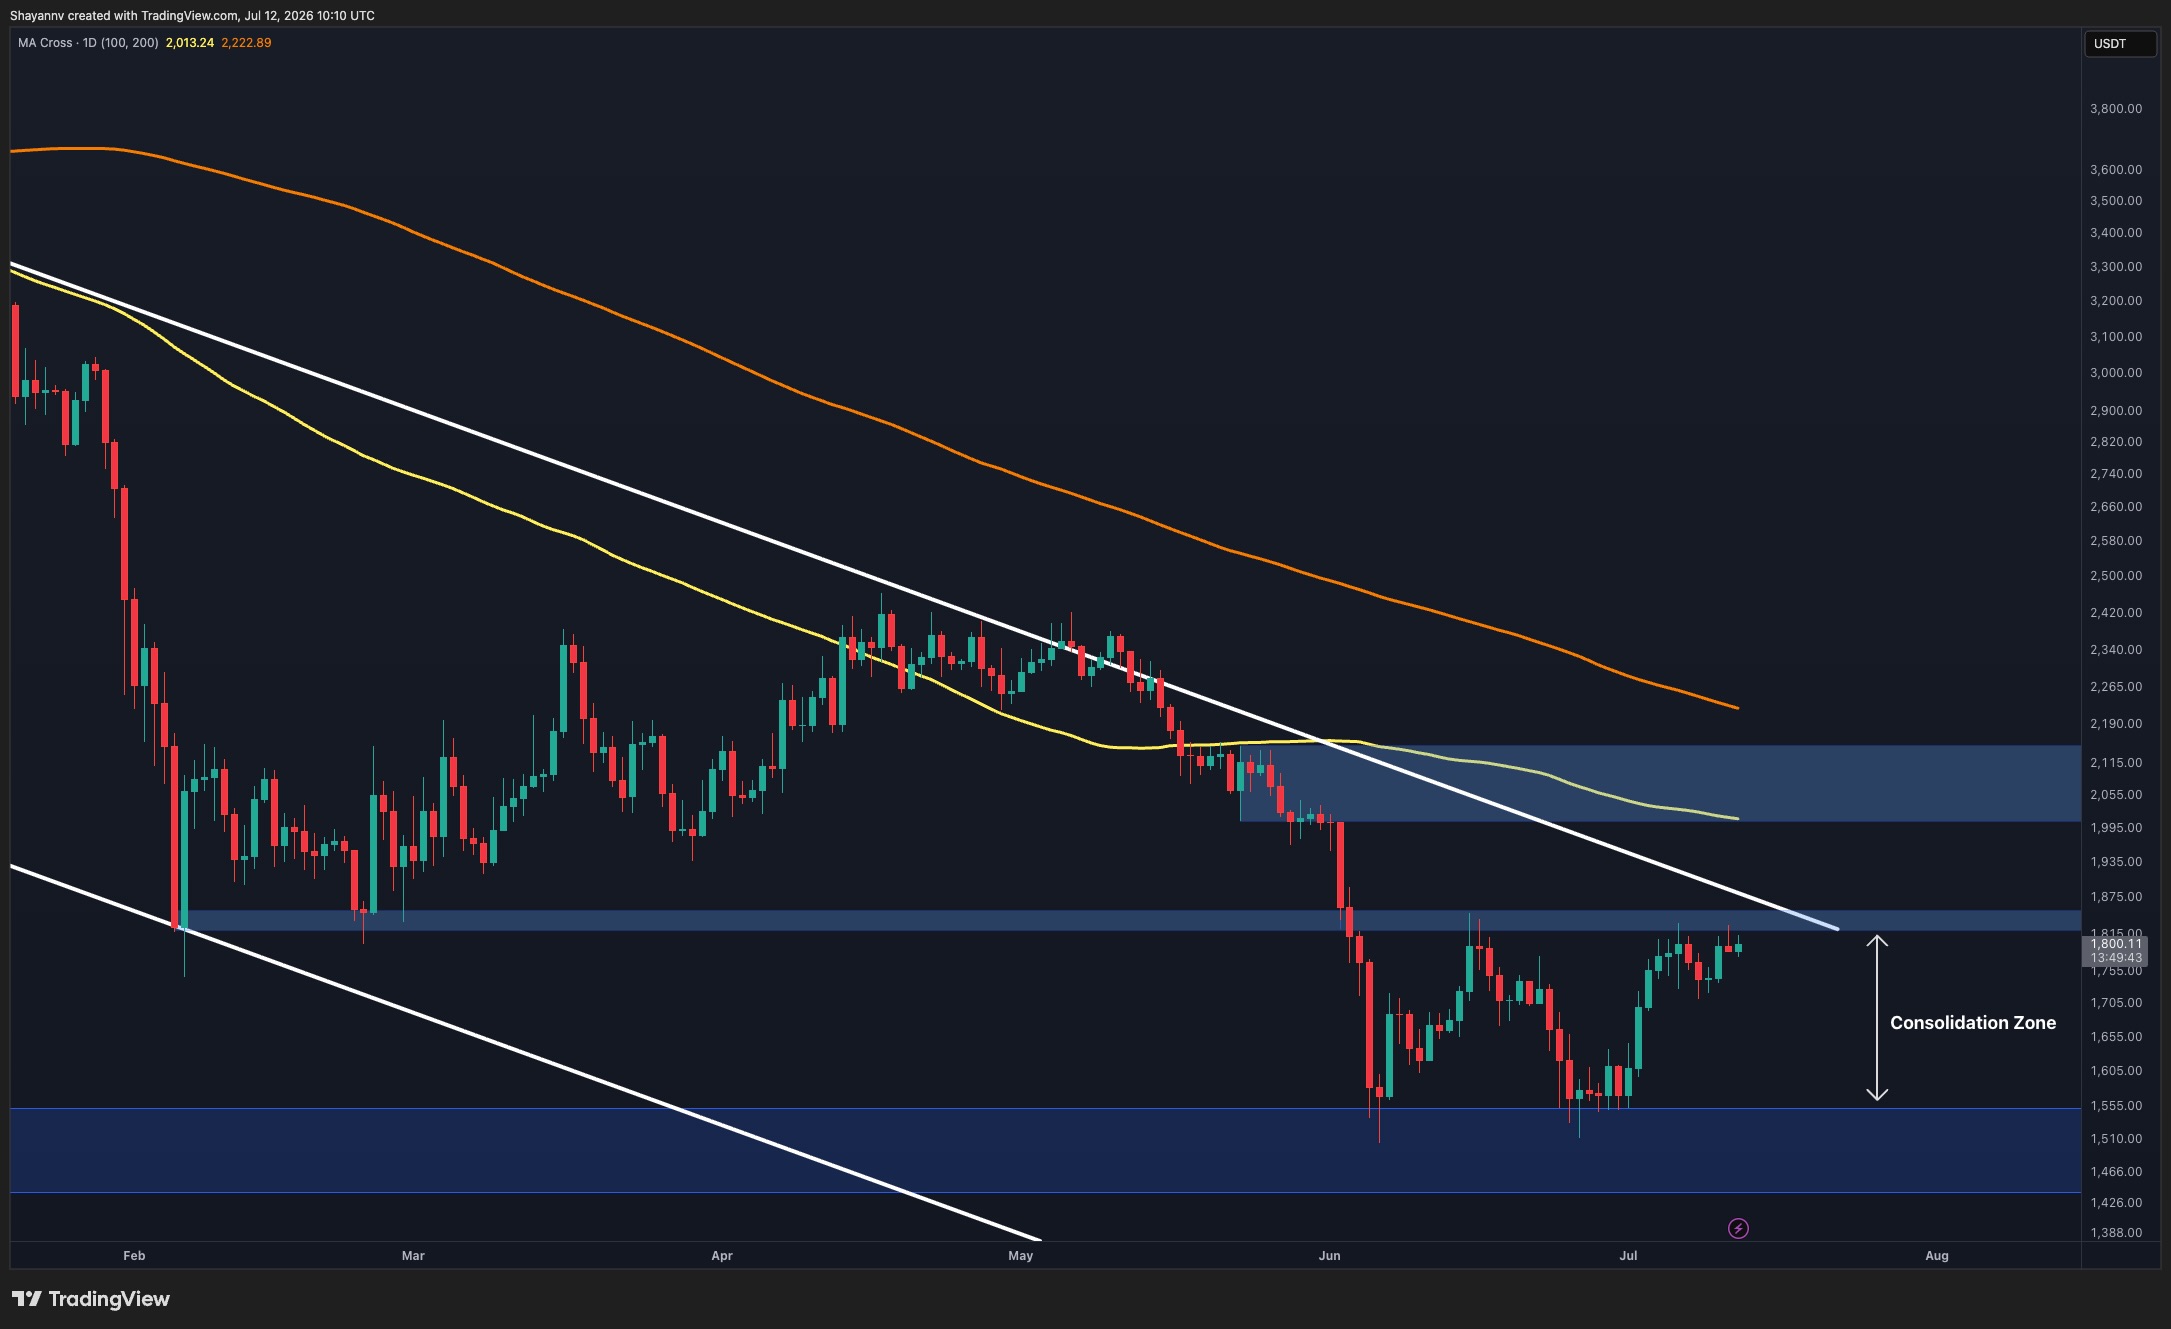
Ethereum is currently facing its most significant technical challenge of the year as it attempts to break through a dense layer of resistance on its journey back toward the $2,000 psychological milestone.
Ethereum is currently testing a critical resistance zone near $2,000, where technical indicators and liquidation data suggest a major trend-defining battle is underway between bulls and bears.
After a resilient recovery from the lows seen in June, Ethereum (ETH) has captured the attention of American retail investors once again. As the second-largest cryptocurrency by market cap, its performance often dictates the health of the entire altcoin market. However, reaching the $2,000 mark isn't just a matter of momentum; it involves clearing a complex "confluence" (a meeting point of multiple technical indicators) that has historically rejected price increases.
The Great Wall of Ethereum Resistance
Technical analysts are laser-focused on the current price action because Ethereum is stuck beneath a "death cross" shadow. This occurs when short-term price averages fall below long-term ones, signaling bearish sentiment. For ETH to sustain this rally, it must flip these previous ceilings into new floors of support.
Liquidity maps suggest that a high concentration of "short positions" (bets that the price will fall) are clustered just above current levels. If Ethereum manages to push through, it could trigger a "short squeeze." This phenomenon forces sellers to buy back their positions, unintentionally fueling an even faster price spike toward $2,000.
Key Technical Indicators to Watch
- Relative Strength Index (RSI): A tool measuring price speed; currently showing ETH is nearing "overbought" territory.
- 200-Day Moving Average: The long-term trend line that ETH has struggled to close above for several months.
- Volume Profiles: On-chain data showing where the most trading activity has occurred, marking heavy sell-zones.
Decentralized Finance and Ethereum's Utility
The drive toward $2,000 isn't just about charts; it's about the ecosystem's health. Most activity in the market occurs through Investopedia DeFi explainer protocols, which rely on Ethereum's network to function. When the price of ETH rises, the "Total Value Locked" (TVL)—the dollar value of assets held in these protocols—generally increases, attracting more capital.
However, high Ethereum prices often lead to higher "gas fees" (the transaction costs paid to the network). For US investors using apps like Uniswap or Aave, a rally to $2,000 might mean paying more for a single trade than they would on a centralized exchange like Coinbase.
"The $2,000 level serves as a psychological gatekeeper. Breaking it doesn't just change the price; it changes the market narrative from 'recovering' to 'bullish'."
What This Means for USA Investors
For investors based in the United States, Ethereum's local environment is shaped by both price action and policy. If you trade ETH on major domestic platforms like Coinbase, Kraken, or Gemini, you should be aware of the following factors:
- IRS Tax Treatment: The IRS views ETH as property. Selling ETH at a profit near the $2,000 mark will trigger capital gains taxes, even if you just trade it for another crypto like USDC.
- SEC Posture: The Securities and Exchange Commission continues to debate whether ETH's "Staking" (earning rewards for securing the network) qualifies it as a security. This creates localized volatility for US-based staking services.
- USD Strength: Because ETH is priced in U.S. Dollars (USD), a strong Dollar can often put downward pressure on Ethereum's price, making the $2,000 breakout harder to achieve.
Potential Scenarios for the Coming Week
Market participants are weighing two primary outcomes. In the bullish scenario, Ethereum clears the $1,850 resistance with high trading volume, paving a clear path to $2,100. This would likely be supported by a pause in interest rate hikes by the Federal Reserve, which generally favors "risk-on" assets like crypto.
Conversely, a rejection at this level could lead to a "correction" (a healthy price drop after a rally). If ETH fails to hold the $1,700 support zone, it may revisit the June lows, providing a potential entry point for long-term investors who believe in the network's future utility.
Key Takeaways
- Identify the $2,000 level as a psychological and technical barrier that could dictate the next major trend.
- Monitor liquidation zones where high-leverage short positions may trigger a 'short squeeze' price spike.
- Evaluate the moving average confluence which is providing a ceiling for current Ethereum price action.
- Assess the impact of U.S. macroeconomic data and Treasury yields on high-beta assets like Ethereum.
- Maintain long-term perspectives by watching support floors established during the June market lows.