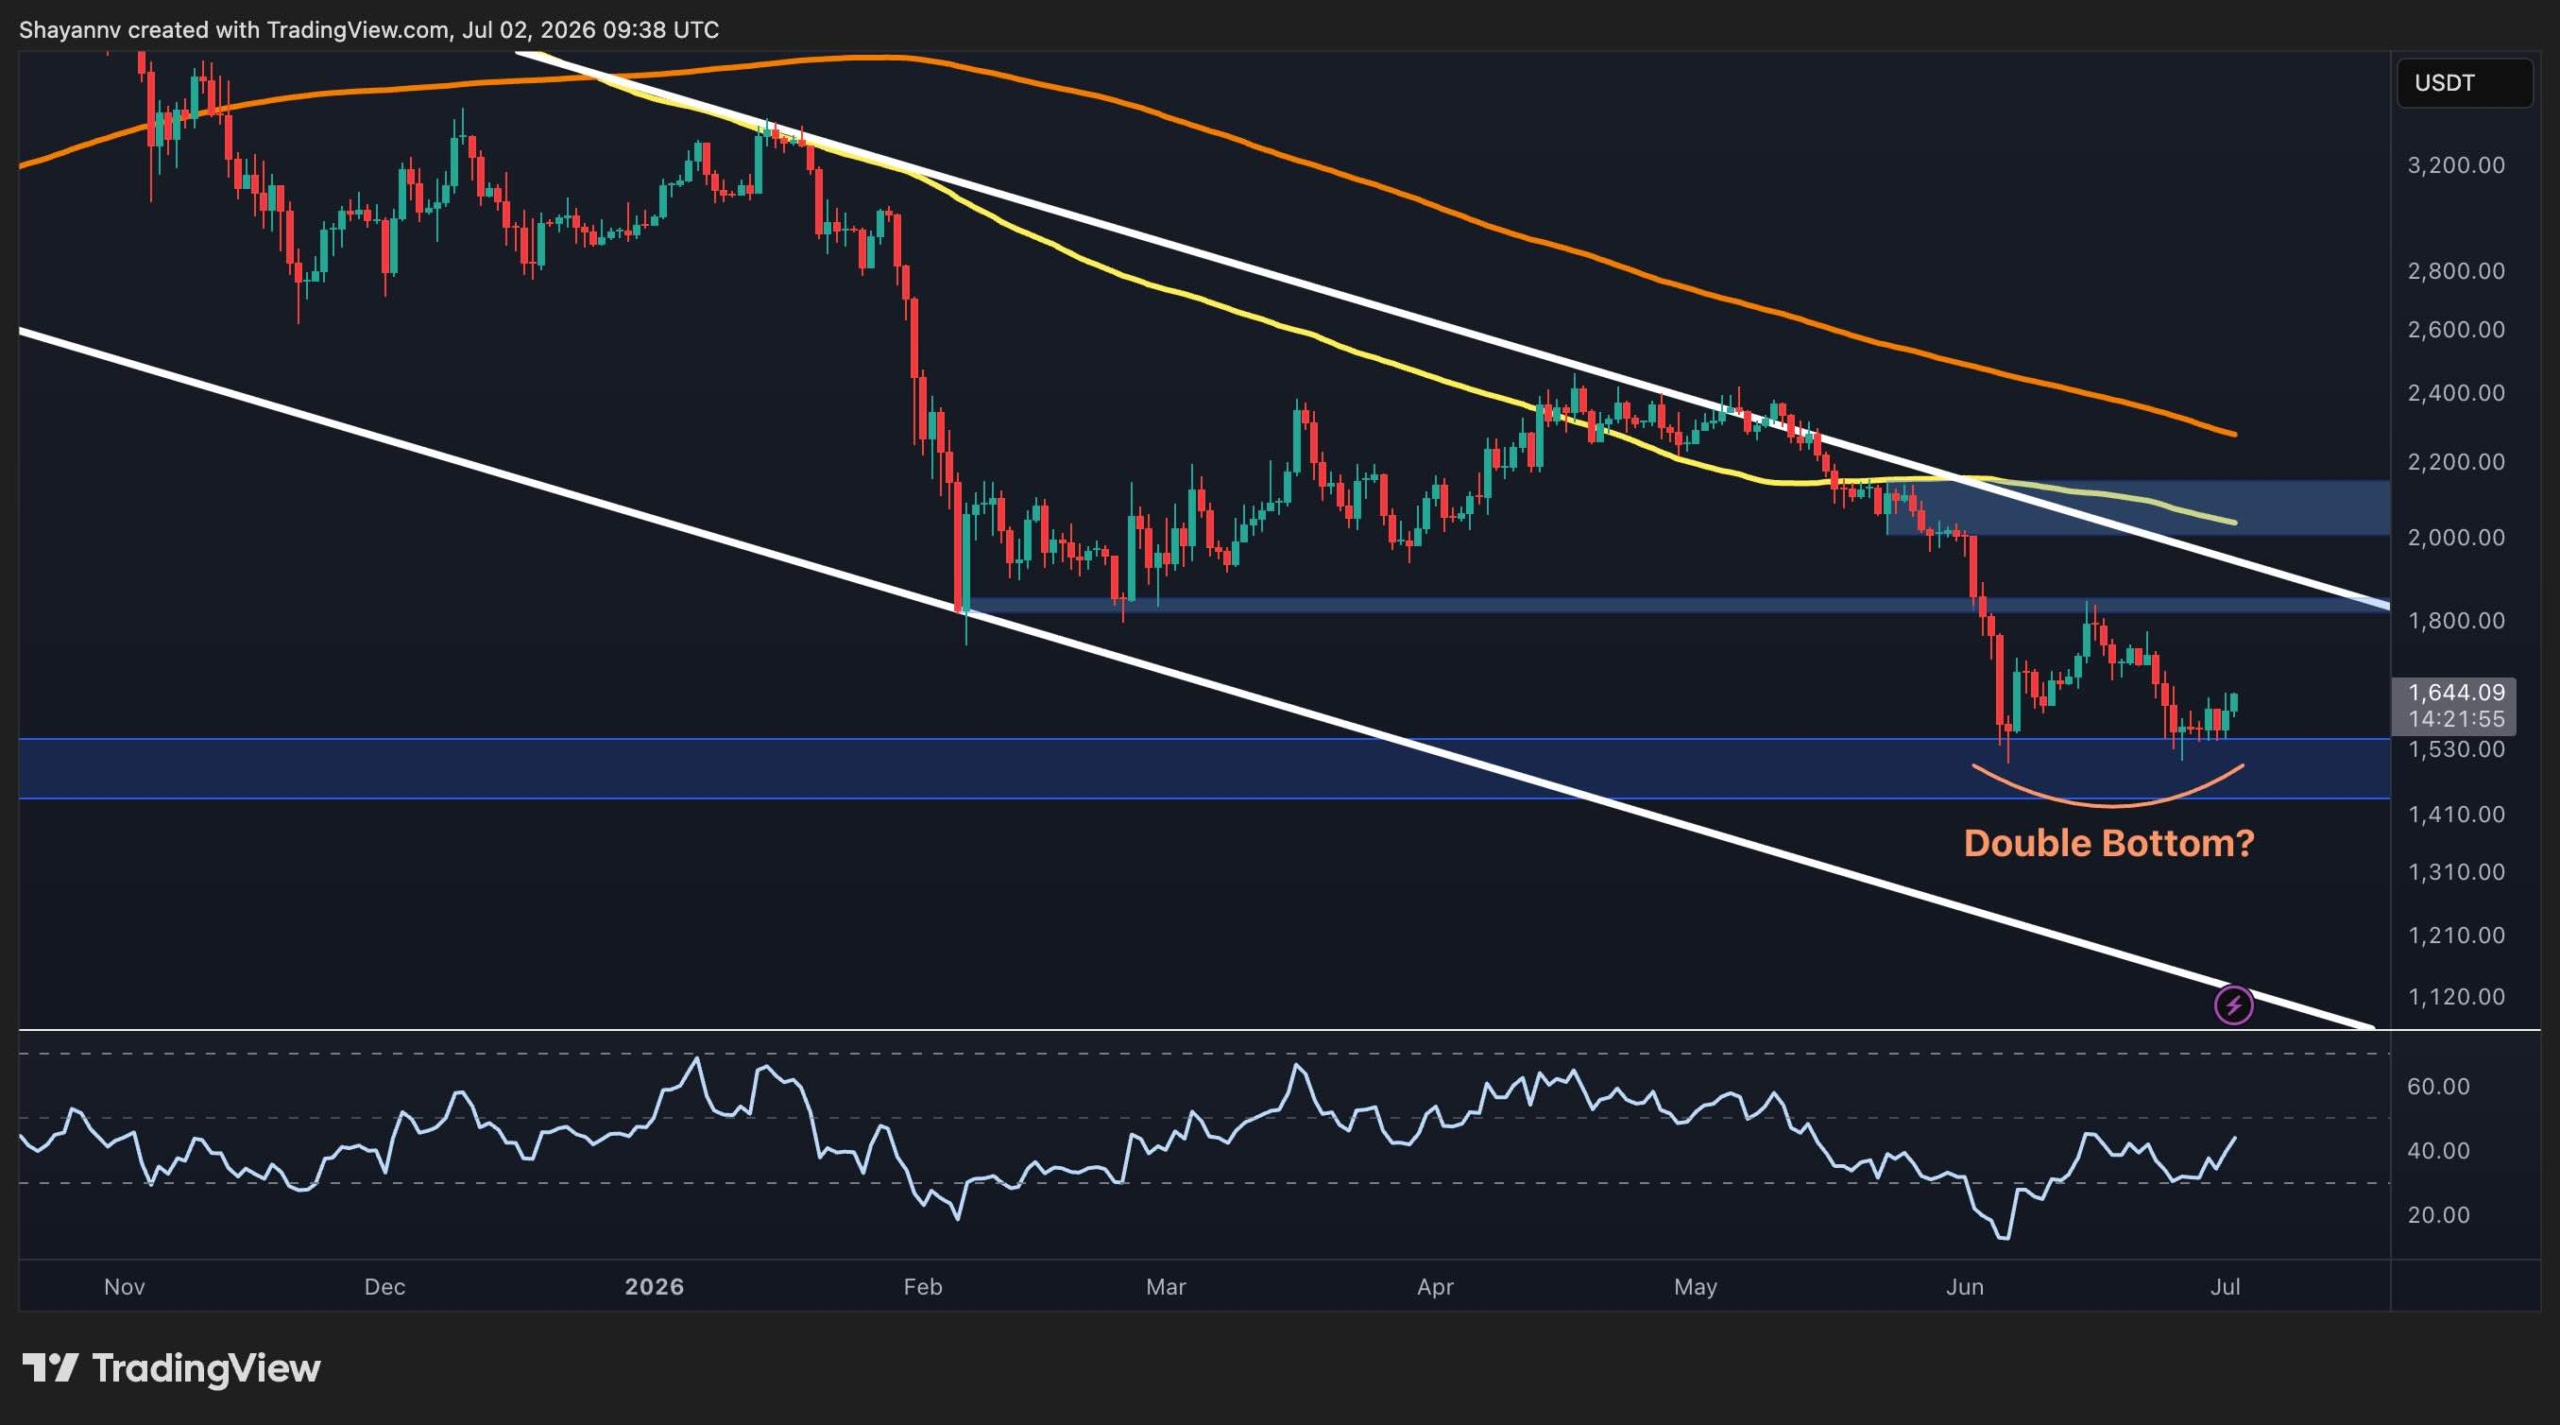
Ethereum is currently testing a critical support level at $1,500, forming a bullish technical pattern that suggests the recent sell-off may be losing its grip on the market.
Ethereum is showing a bullish 'double bottom' technical pattern near the $1,500 support level, suggesting a potential relief rally could be imminent if buyer momentum continues to build.
For American investors watching the charts this week, Ethereum (ETH) is a primary focus as it attempts to stabilize following a period of persistent selling pressure. ETH recently touched the $1,500 price point twice, creating a specific visual setup known as a "double bottom." This development is significant for US traders using platforms like Coinbase or Kraken, as it often marks the exhaustion of an existing downtrend and the start of a new upward move.
Understanding the Double Bottom Signal
A double bottom is a technical analysis pattern that looks like the letter "W" on a price chart. It occurs when a cryptocurrency’s price drops to a specific level, bounces back, and then drops back to that same level again before recovering.
In Ethereum's case, the $1,500 region is acting as a sturdy floor. When the price fails to break below this level a second time, it indicates that buyers are stepping in with enough force to absorb the supply from sellers. For intermediate investors, seeing this pattern near a round psychological number like $1,500 provides a clearer entry point for potential gains.
This technical shift comes at a time when short-term momentum is slowly shifting color from red to green. While the long-term trend still has hurdles to clear, the immediate pressure from shorts—traders betting on the price to fall—appears to be diminishing.
The Role of Market Liquidity and DeFi
Ethereum remains the backbone of the decentralized finance (DeFi) ecosystem. Many US investors utilize Ethereum not just as a speculative asset, but as the underlying collateral for lending and borrowing protocols. As the price stabilizes, the risk of cascading liquidations in these protocols decreases.
To better understand how these systems work, you can read this Investopedia DeFi explainer which details the mechanics of peer-to-peer financial services. The health of the Ethereum network and the DeFi sector are intrinsically linked; when ETH price finds a bottom, it usually brings a sigh of relief to the entire altcoin market.
"The $1,500 level is not just a line on a chart; it represents a zone where long-term holders and institutional dip-buyers have decided that Ethereum is undervalued relative to its utility."
Critical Hard and Soft Resistance Levels
While the double bottom is an optimistic sign, Ethereum isn't in the clear just yet. To confirm a "relief rally" (a temporary period of price increase during a bear market), ETH must climb above several key resistance levels. Resistance is a price point where selling pressure is high enough to prevent the price from rising further.
- Immediate Resistance: The mid-point of the "W" pattern, often referred to as the neckline.
- Moving Averages: The 50-day and 200-day averages serve as benchmarks for trend health.
- Volume Confirmation: A rally is only sustainable if it is supported by high trading volume.
If buyers can push Ethereum past these hurdles, the next major target typically cited by analysts is the $1,800 to $2,000 range. However, failure to hold the $1,500 support could lead to a further slip toward the $1,350 mark.
What This Means for USA Investors
For investors based in the United States, the current Ethereum price analysis should be viewed through the lens of local regulatory and tax environments. Ethereum is currently available on all major US-regulated exchanges, including Coinbase and Gemini, making it one of the most accessible assets for US retail portfolios.
- Tax Implications: The IRS treats cryptocurrency as property. Selling ETH during a relief rally for a profit will trigger a capital gains tax event.
- Regulatory Posture: The SEC (Securities and Exchange Commission) and CFTC (Commodity Futures Trading Commission) continue to debate Ethereum's classification, which can cause sudden price swings.
- USD Strength: Because Ethereum is largely traded against the US Dollar (USD), the strength of the DXY (US Dollar Index) often moves inversely to ETH. If the dollar weakens, ETH often gains.
American investors should also keep an eye on federal interest rate announcements. High-interest environments generally pull liquidity out of "risk-on" assets like crypto and into safer yields like Treasury bonds.
Preparing for the Move
As Ethereum eyes this potential breakout, it is vital to practice proper risk management. While the technical double bottom is a classic bullish indicator, crypto markets are notoriously volatile. Many US traders choose to use "stop-loss" orders (automated instructions to sell if the price hits a certain low) to protect their principal investment if the $1,500 floor fails to hold.
In conclusion, the current setup suggests that the worst of the recent decline might be over for now. If Ethereum can reclaim its momentum, we may see the return of optimism across the broader digital asset space heading into the next fiscal quarter.
Key Takeaways
- Identify the $1,500 price floor as a critical psychological and technical support zone for Ethereum.
- Monitor the 'double bottom' pattern which often signals the end of a downtrend for ETH.
- Watch for a breakout above the immediate resistance levels to confirm a sustained relief rally.
- Evaluate US market sentiment as institutional interest remains a key driver for Ethereum's recovery.
- Prepare for volatility as Federal Reserve interest rate decisions continue to influence crypto liquidities.