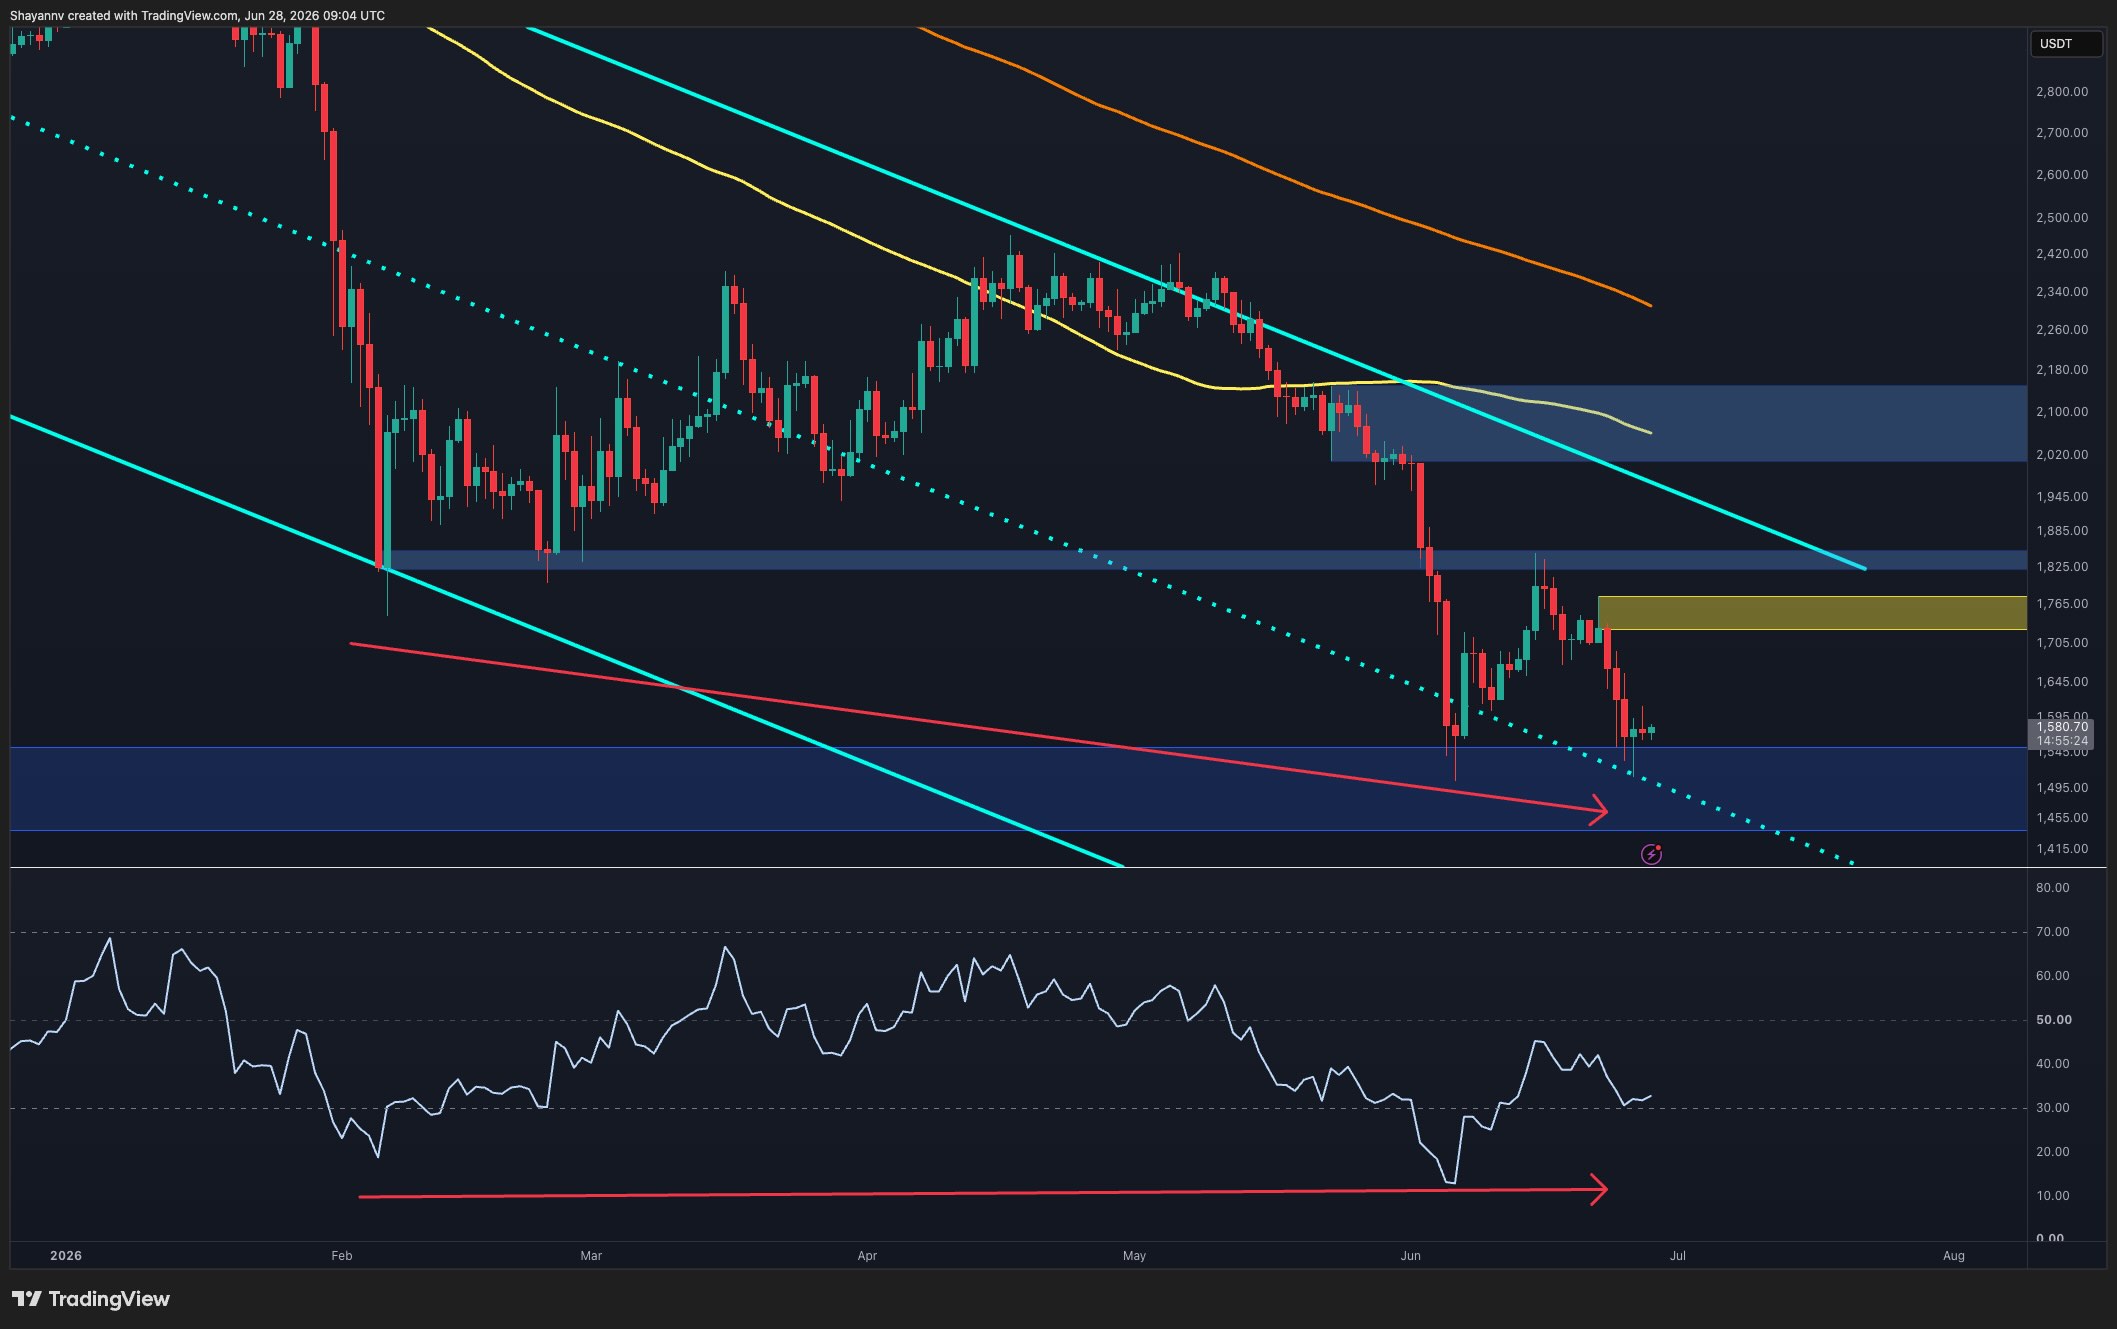
Ethereum is currently flashing a rare technical signal known as a bullish divergence on its daily chart, suggesting that the recent aggressive sell-off may finally be losing its steam.
Ethereum shows a bullish RSI divergence on the daily chart, suggesting that selling momentum is fading despite lower prices, which may signal a potential trend reversal or temporary relief rally.
As of late 2024, Ethereum (ETH) has faced significant headwinds, leaving many American investors wondering if the bottom is finally in. While the broader trend remains bearish, price action in the last few days indicates that sellers are reaching an exhaustion point. This shift is occurring just as Ethereum tests major psychological support levels on US-based exchanges like Coinbase and Kraken.
Understanding the Daily RSI Divergence
The core of the current Ethereum price analysis revolves around the Relative Strength Index (RSI). The RSI is a technical momentum indicator that measures the speed and change of price movements on a scale from 0 to 100.
A bullish divergence occurs when the price of an asset continues to make new lower lows, but the RSI indicator starts making higher lows. This discrepancy suggests that while the price is dropping, the actual power behind the selling is weakening. For US traders using tools like TradingView, this is often viewed as a reliable "early warning" that a trend reversal might be around the corner.
Key Support and Resistance Zones
Despite the optimistic RSI signal, ETH is not out of the woods yet. The price must maintain its footing above historical support zones to invalidate the bearish trend. Many analysts are looking at the mid-$2,000 range as the line in the sand for bulls.
- Immediate Support: High-volume nodes where buyers historically step in.
- Secondary Support: Long-term moving averages that provide a safety net.
- Overhead Resistance: Technical barriers where sellers are likely to offload their holdings.
If the RSI divergence plays out, the first target for a relief rally would be the nearest daily resistance level. However, failing to hold current support could lead to a "trap" where the price continues to slide regardless of the momentum indicators.
The Role of Institutional Sentiment
Since the approval of Spot Ethereum ETFs (Exchange-Traded Funds) in the United States, price action is increasingly tied to Wall Street's appetite. When institutional volume slows down, technical indicators like the RSI become more prominent in driving short-term price discovery.
"Technical patterns like RSI divergence often act as a self-fulfilling prophecy when enough algorithmic traders and retail investors identify the same exhaustion signal simultaneously."
Investors should also consider the broader environment of Investopedia DeFi explainer to understand how Ethereum's utility impacts its long-term valuation beyond simple chart patterns. A healthy DeFi ecosystem typically supports a higher ETH price floor.
Evaluating Market Momentum
To confirm a true reversal, traders often look for a sequence of events rather than a single indicator. The following sequence is currently being monitored by market participants:
- Formation of the higher low on the RSI indicator while price hits a local bottom.
- Price breakout above the most recent short-term resistance level on high volume.
- Successful retest of that broken resistance, turning it into new support.
This systematic approach helps investors avoid "catching a falling knife," a term used when buying an asset that is dropping rapidly without signs of stabilization.
What This Means for USA Investors
For those filing taxes in the United States, it is vital to remember that the IRS (Internal Revenue Service) treats every crypto-to-crypto and crypto-to-fiat trade as a taxable event. Buying ETH during a dip might lower your cost basis, but selling for a profit later will trigger capital gains taxes.
The SEC (Securities and Exchange Commission) continues to provide oversight on how Ethereum is marketed and traded. Currently, ETH is widely available on regulated US platforms like Coinbase, Gemini, and Kraken, making it one of the most accessible assets for American portfolios. Always ensure your ETH is valued in USD (US Dollars) when calculating potential tax liabilities or portfolio weightings.
Conclusion: Temporary Bounce or Trend Shift?
While the RSI divergence is a classic signal of a potential bottom, it requires confirmation from broader market factors. A sudden shift in Federal Reserve policy or unexpected US economic data could easily override technical patterns. For now, the charts suggest that the worst of the recent Ethereum sell-off might be behind us, but caution remains the best strategy for intermediate investors.
Key Takeaways
- Identify the daily RSI divergence as a primary signal for fading bearish momentum.
- Monitor the critical support levels to ensure the bullish thesis remains valid.
- Observe seller exhaustion after weeks of sustained downward pressure on ETH.
- Assess broader market sentiment to confirm if institutional flows align with technicals.
- Evaluate the potential for a relief rally toward key overhead resistance zones.