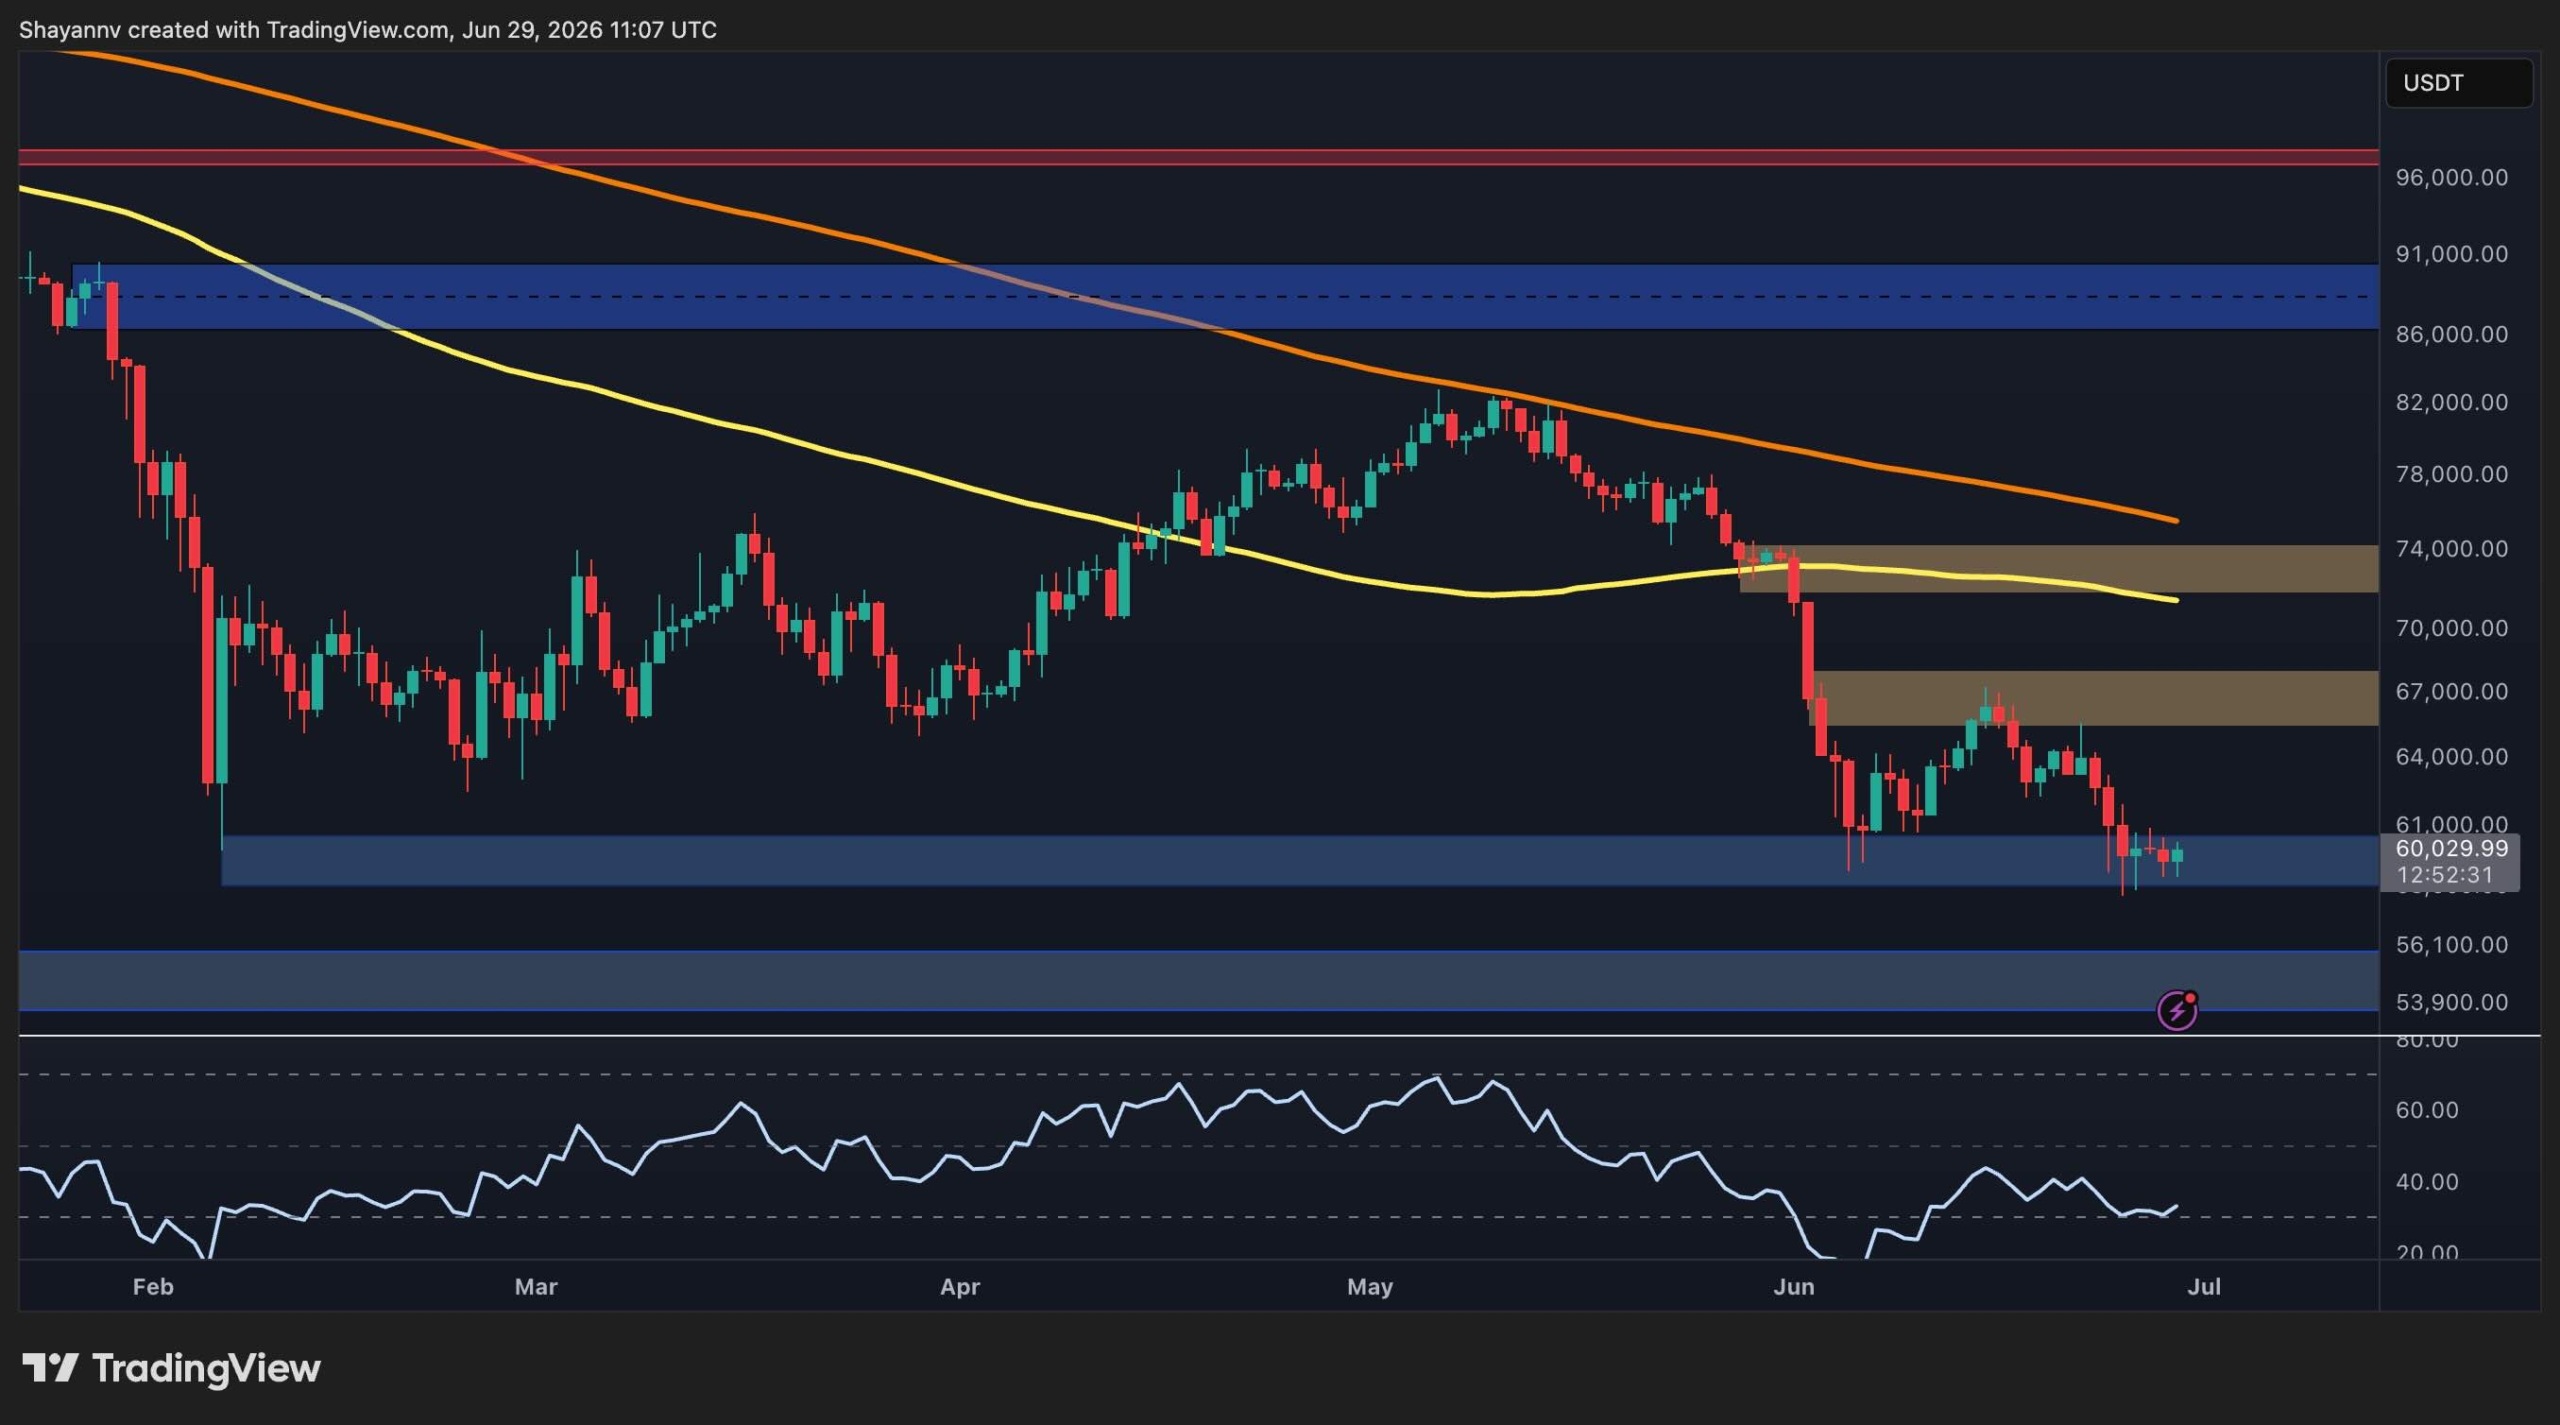
If Bitcoin fails to hold its current $60,000 support level, technical data suggests the price will likely slide toward the $54,000 zone.
Bitcoin is currently hovering around the $60,000 mark; if it fails to remain above this psychological floor, technical indicators suggest a further decline toward the $54,000 support zone is highly probable.
Bitcoin (BTC) is currently facing intense selling pressure as it teeters on the edge of the $60,000 psychological barrier. For American investors watching their Coinbase or Kraken accounts, this volatility marks a critical turning point in the mid-year market cycle. While the asset remains the leading digital currency, technical indicators suggest that the bulls—investors who want the price to go up—are losing ground to the bears.
Understanding the $60,000 Psychological Floor
In the world of crypto, "support" refers to a price level where a downtrend tends to pause due to a concentration of demand. For Bitcoin, $60,000 is more than just a number; it is a psychological anchor. Many institutional investors in the USA viewed this level as a safe entry point earlier this year.
The current market structure appears to favor sellers. If the price closes decisively below $60,000 on a daily timeframe, it signals that the market lacks the conviction to keep prices high. Many analysts use technical analysis (studying past price charts to predict future moves) to identify where the next floor might be. Currently, all signs point to the mid-50s.
Why $54,000 Is the Next Big Target
If the $60,000 floor cracks, the next major "demand zone"—an area where buyers typically outweigh sellers—sits near $54,000. This level matches previous price action from earlier months, creating a historical safety net for the asset. A drop to this level would represent a roughly 10% decline from the current breakdown point.
"Volatility is not a bug in the Bitcoin system; it is a feature that creates opportunities for long-term accumulation."
Investors should look for several signs of a deeper correction:
- Increased Trading Volume: A high-volume drop below $60,000 confirms the move is significant.
- RSI Levels: The Relative Strength Index (a momentum tool) falling below 30 would suggest Bitcoin is "oversold."
- Exchange Inflows: When more Bitcoin moves onto exchanges, it usually indicates people are ready to sell.
The Role of Macro Factors and DeFi Trends
The broader financial landscape also plays a role in Bitcoin's price discovery. High interest rates in the U.S. often make "risk-on" assets like crypto less attractive compared to Treasury bonds. Furthermore, the health of decentralized finance (DeFi) ecosystems can impact Bitcoin as it is often used as collateral within these platforms. For those new to these concepts, this Investopedia DeFi explainer provides excellent context on how digital assets interact with financial protocols.
Key Metrics to Track
- The 200-Day Moving Average: This provides a long-term view of the trend.
- Fear and Greed Index: Currently shifting toward "Fear," which sometimes precedes a market bottom.
- U.S. Spot ETF Inflows: Watch if BlackRock and Fidelity investors are buying the dip or exiting positions.
What This Means for USA Investors
For American investors, a move to $54,000 has specific implications. First, the IRS treats Bitcoin as property, meaning any sale at the $60,000 level would trigger a capital gains tax event—potentially a loss if you bought higher (tax-loss harvesting). Second, the SEC (Securities and Exchange Commission) continues to monitor exchange stability during high-volatility events, so ensure your funds are on a regulated U.S. platform like Coinbase, Gemini, or Kraken.
The federal government's stance on interest rates remains the primary driver for USD-denominated Bitcoin prices. If the dollar remains strong, Bitcoin may face continued headwinds. However, many domestic investors view a drop to $54,000 as a "buy the dip" opportunity for their long-term retirement portfolios or IRAs.
Looking Ahead: Recovery or Recession?
Is $54,000 inevitable? In crypto, nothing is guaranteed. A sudden surge in institutional buying or a positive shift in U.S. economic data could spark a relief rally (a temporary price increase during a bear market). This would likely target a return to $64,000 or higher.
Ultimately, US-based intermediate investors should focus on Dollar Cost Averaging (DCA)—buying small amounts regularly—rather than trying to time the exact bottom. Whether Bitcoin holds $60k or hits $54k, the long-term thesis for the asset as "digital gold" remains a central debate in American finance.
Key Takeaways
- Monitor the $60,000 support level as a decisive indicator for near-term market direction.
- Identify $54,000 as the secondary demand zone where buyers historically step in.
- Prepare for increased volatility due to bearish broader market structures and selling pressure.
- Watch for potential 'oversold' signals on the RSI to identify possible trend reversals.