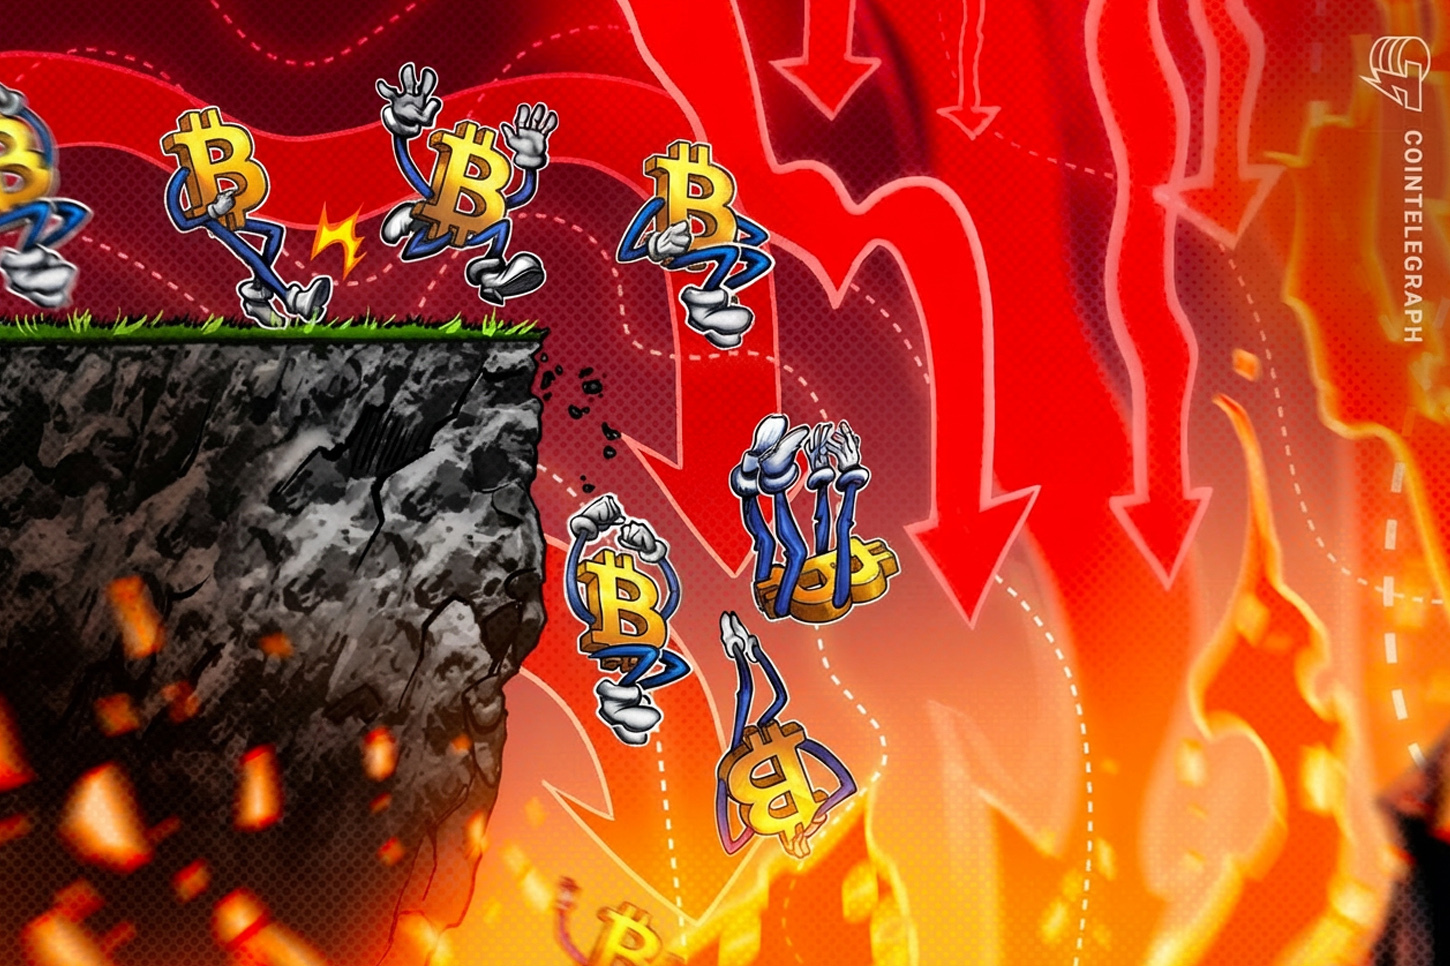
Bitcoin is facing a potential downward trend toward $52,000 following a disappointing June close that failed to reclaim critical long-term support levels.
Bitcoin experienced its worst June performance since 2022, closing below key moving averages and signaling a potential price correction toward the $52,000 level for American investors.
After a volatile month, U.S. investors are bracing for further turbulence as Bitcoin (BTC) concludes its weakest June performance since the 2022 market crash. The digital asset struggled to maintain momentum, leaving portfolios across Coinbase and Kraken in the red as technical indicators flash warning signs.
The Significance of the June Monthly Close
In the world of crypto, monthly closes act as psychological markers for institutional and retail traders alike. For Bitcoin, closing below the 200-week moving average—a trend line showing the average price over the last four years—suggests that the market lacks the strength to launch a new bull run immediately.
While Bitcoin stayed above its realized price (the average price at which all coins last moved), the failure to break higher is weighing on sentiment. Many traders look at CoinGecko data to track how these monthly losses compare to previous cycles, and the current setup mirrors late-stage bear market behavior.
"The June close above realized price but below the 200-week moving average signals the bear bottom is still ahead per prior cycles."
Why $52,000 is the New Magic Number
If the current support levels fail to hold, analysts are eyeing $52,000 as a logical landing spot. This price point represents a significant area of liquidity (a price level where there are many buy and sell orders), which often acts as a magnet during market corrections.
There are several reasons why the market is leaning toward a bearish outlook right now:
- Reduced Demand: The initial hype surrounding U.S. Spot ETFs has cooled significantly.
- Macro Uncertainty: Upcoming Federal Reserve decisions on interest rates continue to push investors toward safer assets like the U.S. Dollar.
- Miner Capitulation: Bitcoin miners (companies that use high-powered computers to secure the network) may be selling their holdings to cover operational costs post-halving.
Identifying the Indicators of a Bottom
To determine if the bottom is truly in, investors should watch how Bitcoin reacts to the Short-Term Holder Realized Price. This metric tracks the average cost basis of investors who bought within the last 155 days. Historically, when the market price drops below this level, it triggers a final "washout" before a recovery.
- Monitor the Relative Strength Index (RSI) for oversold conditions on the daily chart.
- Watch for a decrease in exchange inflows, which suggests fewer people are preparing to sell.
- Look for a stabilization in the flow of funds into U.S.-based Bitcoin ETFs like BlackRock's IBIT.
What This Means for USA Investors
For American investors, this price action has direct implications for tax planning and portfolio management. If you are holding Bitcoin on a U.S. exchange like Gemini or Robinhood, a drop to $52,000 could present a tax-loss harvesting opportunity. This is a strategy where you sell an asset at a loss to offset capital gains elsewhere, potentially lowering your IRS bill.
Regulatory and Exchange Context
The SEC (Securities and Exchange Commission) continues to keep a close eye on market volatility. While the existence of Spot ETFs provides more ways to trade BTC in a brokerage account, it also means Bitcoin is increasingly tied to the movements of the S&P 500 and Nasdaq. Furthermore, U.S. traders should ensure they are using platforms that provide clear 1099-B tax forms to simplify reporting during high-volatility periods.
Price Outlook in USD
Given the strength of the U.S. Dollar Index (DXY), Bitcoin faces an uphill battle. When the dollar is strong, risk assets like crypto typically face selling pressure. Investors should keep an eye on the $60,000 support level; if that breaks, the path to $52,000 becomes much clearer.
Navigating the Summer Slump
Historically, the summer months are periods of lower volume (the total amount of an asset traded). Lower volume often leads to sharper price swings, as it takes less capital to move the market. Beginners should avoid over-leveraging—using borrowed funds to trade—and instead focus on Dollar Cost Averaging (DCA), which involves buying small amounts at regular intervals regardless of the price.
Key Takeaways
- Monitor the 200-week moving average as a critical resistance level for long-term sentiment.
- Evaluate historical June performance patterns to anticipate summer market volatility.
- Prepare for potential downside targets near $52,000 if current support levels fail.
- Watch U.S. spot Bitcoin ETF flows for signs of institutional accumulation or exit.