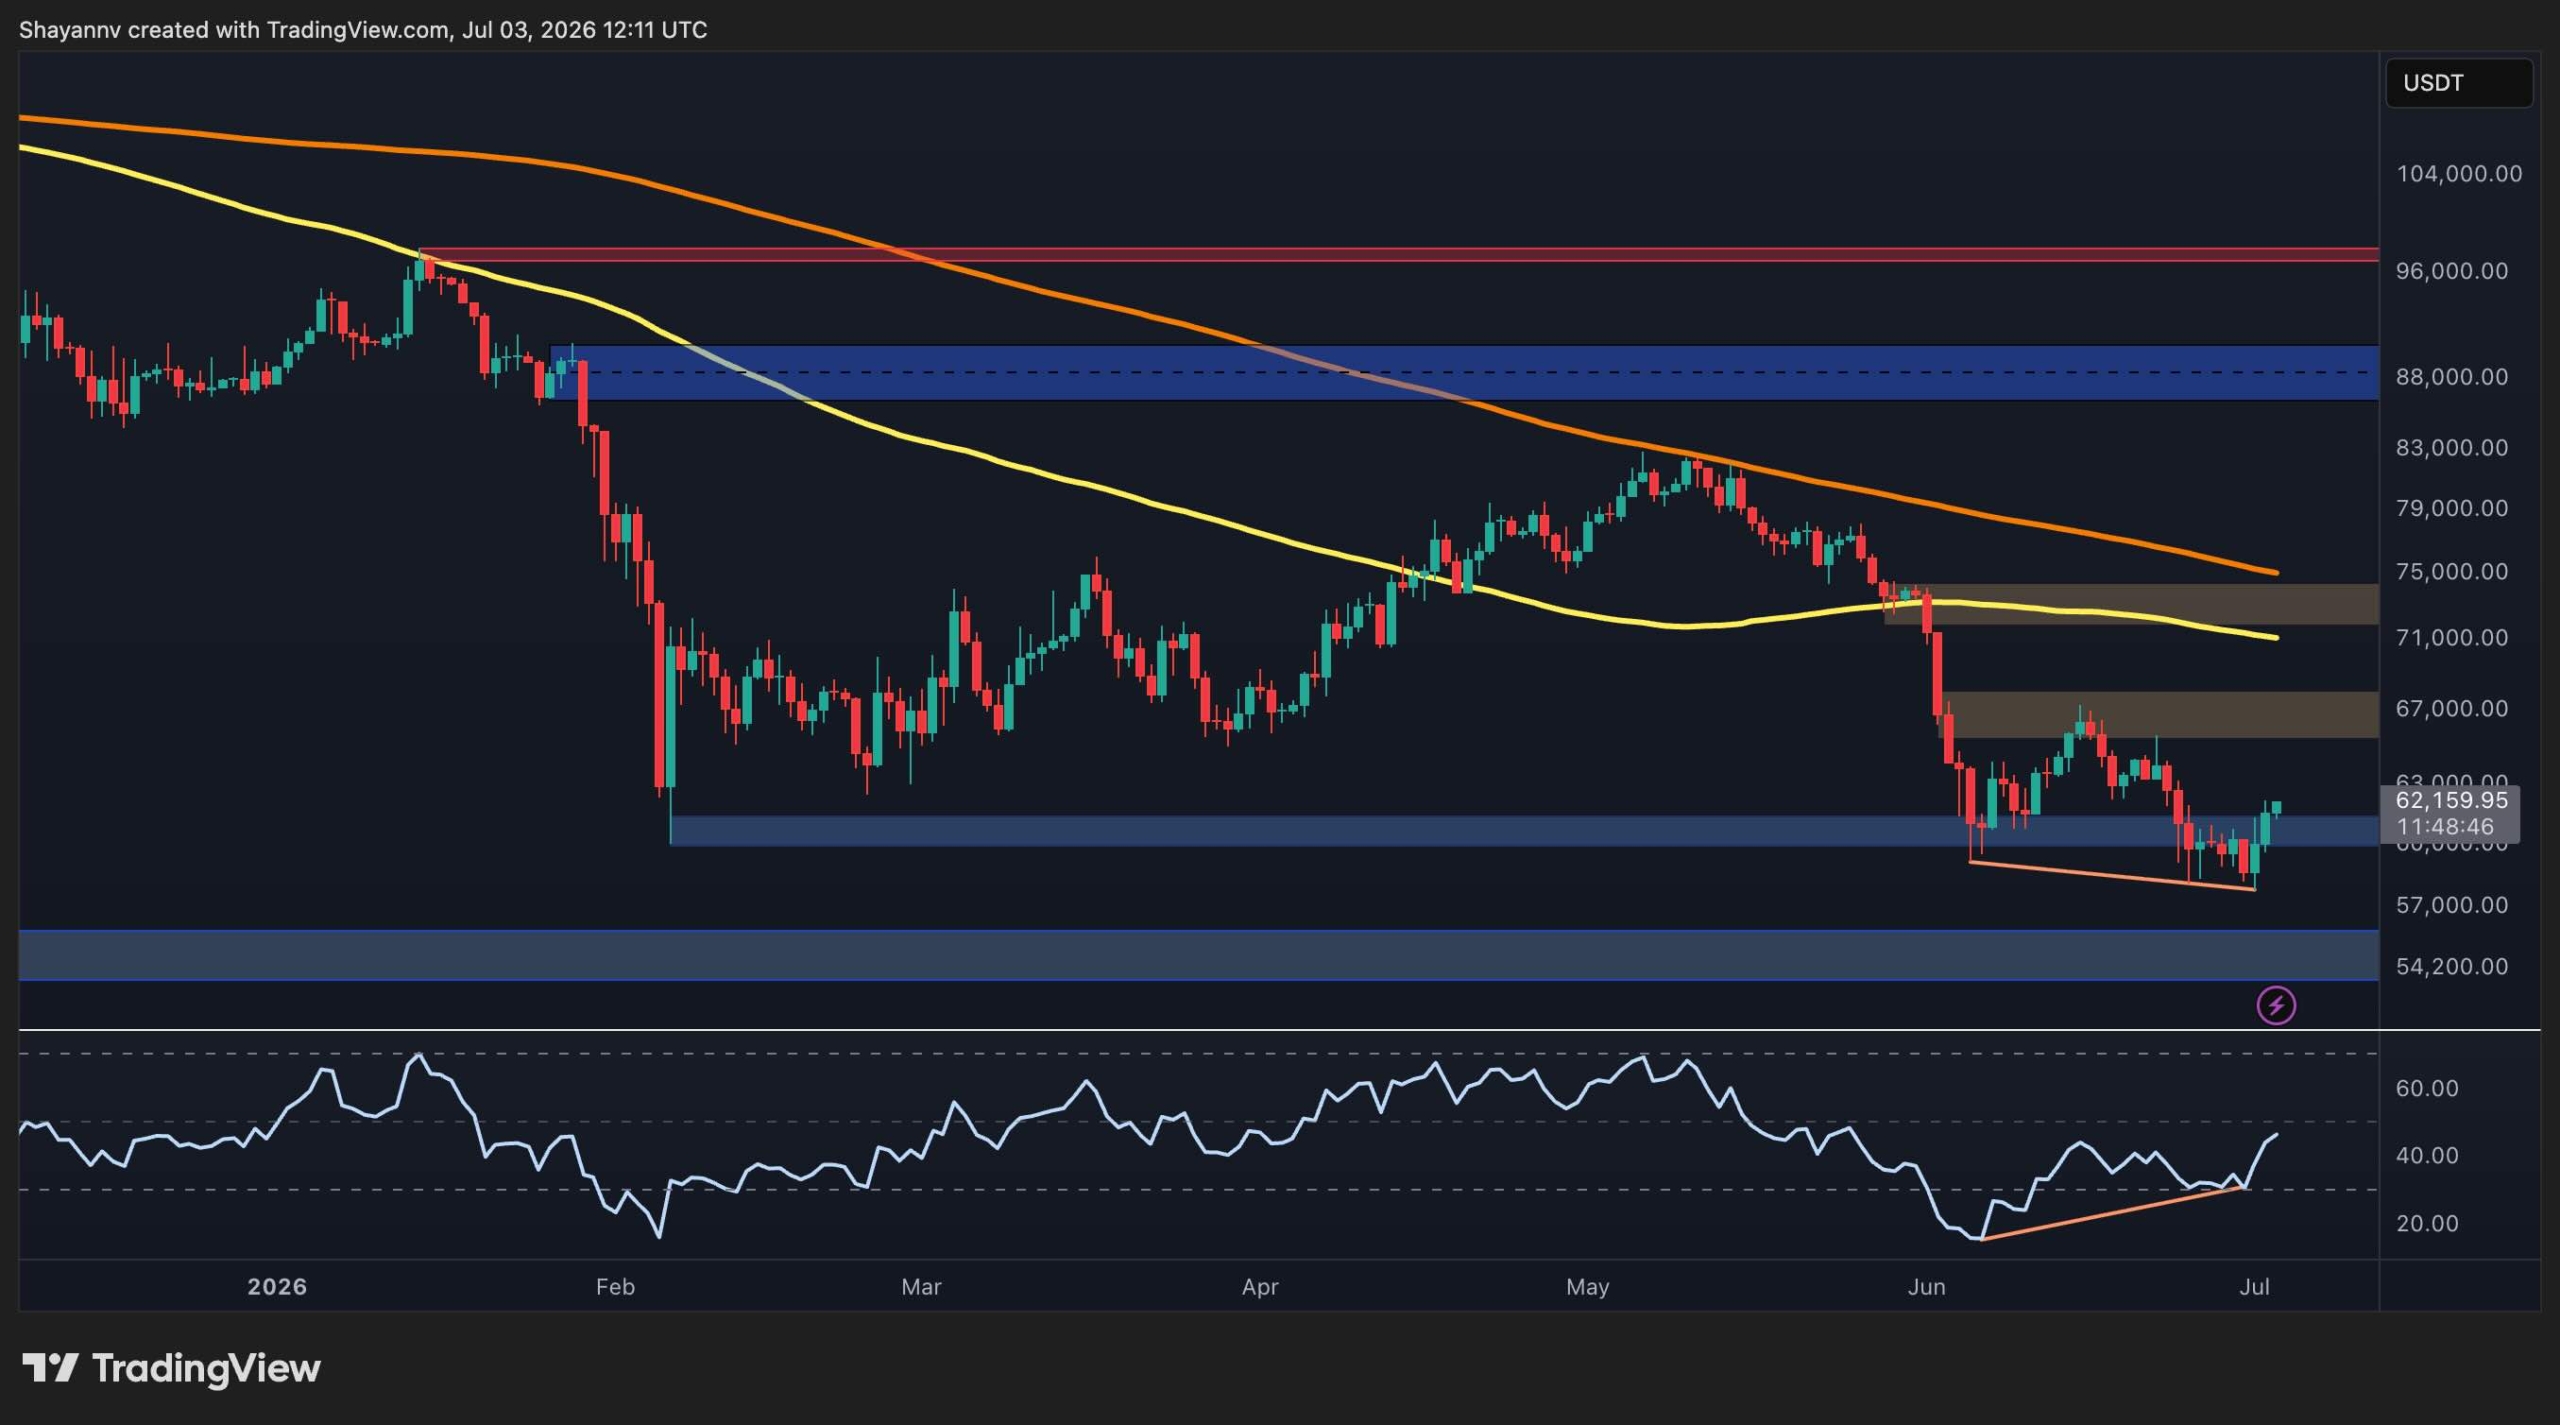
Bitcoin is currently fighting to maintain a recovery trend, but analysts warn that a definitive move above the $72,000 resistance level is required to signal a true market reversal.
Bitcoin is currently attempting a short-term recovery, but a sustained bull run requires the price to decisively break through the $72,000 resistance level to overcome recent selling pressure.
After several weeks of intense selling pressure from both retail and institutional holders, Bitcoin (BTC) is finally showing signs of life. Markets in the United States are closely watching these technical developments as Bitcoin attempts to reclaim its status as a leading inflation hedge.
For US investors, this price action is more than just numbers on a screen. It represents the ongoing struggle between “bears” (investors who expect prices to fall) and “bulls” (those who expect prices to rise) in a high-interest-rate environment.
The Critical Battle for $72,000
The $72,000 level has become a psychological and technical “resistance” (a price point where selling typically increases). Bitcoin must clear this hurdle to convince the market that the recent downtrend is over.
Technical experts look at the Daily Chart to identify patterns. Currently, Bitcoin is trading beneath major resistance levels that have historically triggered sell-offs. Clearing $72K would likely trigger a wave of "FOMO" (fear of missing out) among retail investors.
However, the broader trend remains fragile. While buyers have successfully defended key "support" zones (price levels where buying typically increases to stop a drop), the volume of trades must increase to sustain an upward move toward new all-time highs.
Understanding Market Indicators and Support
To understand where the price is headed, investors often use the Relative Strength Index or RSI (a tool that measures the speed and change of price movements). This helps determine if an asset is “overbought” or “oversold.”
- Defensive Support: Buyers are currently clustering around the $60,000-$64,000 range.
- Volume Trends: A recovery requires higher trading volume on US-based exchanges like Coinbase.
- Moving Averages: Analysts are watching if BTC stays above its 50-day average.
The current landscape suggests that while the "blood in the streets" has slowed, the market lacks the immediate catalyst needed to punch through the $72,000 ceiling. Many investors are turning to an Investopedia DeFi explainer to understand how decentralized finance protocols might offer yield while Bitcoin stays range-bound.
Institutional Pressure in the United States
The role of US-based Spot Bitcoin ETFs (Exchange Traded Funds) cannot be overstated. These financial products allow Americans to buy Bitcoin through traditional brokerage accounts like Robinhood or Fidelity.
"The market is currently digesting a massive amount of supply. Until the institutional 'bid' returns to offset daily outflows, the $72,000 mark will remain a difficult ceiling to crack."
Recent data shows that net inflows into these ETFs have fluctuated. When BlackRock or Fidelity customers buy in bulk, the price tends to surge. Conversely, sustained outflows create a “drag” on the price, making recovery difficult.
What This Means for USA Investors
American investors face a unique set of circumstances during this recovery phase. From tax implications to regulatory oversight, staying informed is vital for portfolio management.
- IRS Tax Treatment: Remember that selling Bitcoin for a profit triggers "Capital Gains" tax. Even if you swap BTC for another crypto, the IRS views it as a taxable event.
- SEC Posture: The Securities and Exchange Commission continues to monitor exchanges. Stick to regulated platforms like Coinbase, Kraken, or Gemini to ensure asset security.
- Exchange Liquidity: Price volatility in the US often peaks during New York Stock Exchange (NYSE) hours as ETF traders enter and exit positions.
The USD price of Bitcoin remains the global gold standard for valuation. As the Federal Reserve contemplates interest rate shifts, Bitcoin’s sensitivity to the US Dollar Index (DXY) will likely increase. A weaker dollar often leads to a stronger Bitcoin.
Final Outlook: Monitoring the Breakout
In summary, the Bitcoin recovery is currently in a “wait and see” mode. While the floor seems to be holding, the ceiling at $72,000 is reinforced by significant sell orders. US investors should watch for a daily candle close above this level as a signal of strength.
Risk management remains paramount. Diversifying into other “Altcoins” (cryptocurrencies other than Bitcoin) may be tempting, but BTC usually leads the market. If Bitcoin fails to break resistance, the rest of the market typically follows it back down.
Key Takeaways
- Identify the $72,000 mark as the critical hurdle for a sustained Bitcoin price recovery.
- Monitor key support zones that buyers are currently defending to prevent further price drops.
- Understand how institutional selling pressure in the US is impacting short-term market momentum.
- Evaluate technical indicators like the RSI to gauge if Bitcoin is overbought or oversold.
- Prepare for localized volatility as US regulatory news continues to influence crypto exchange liquidity.