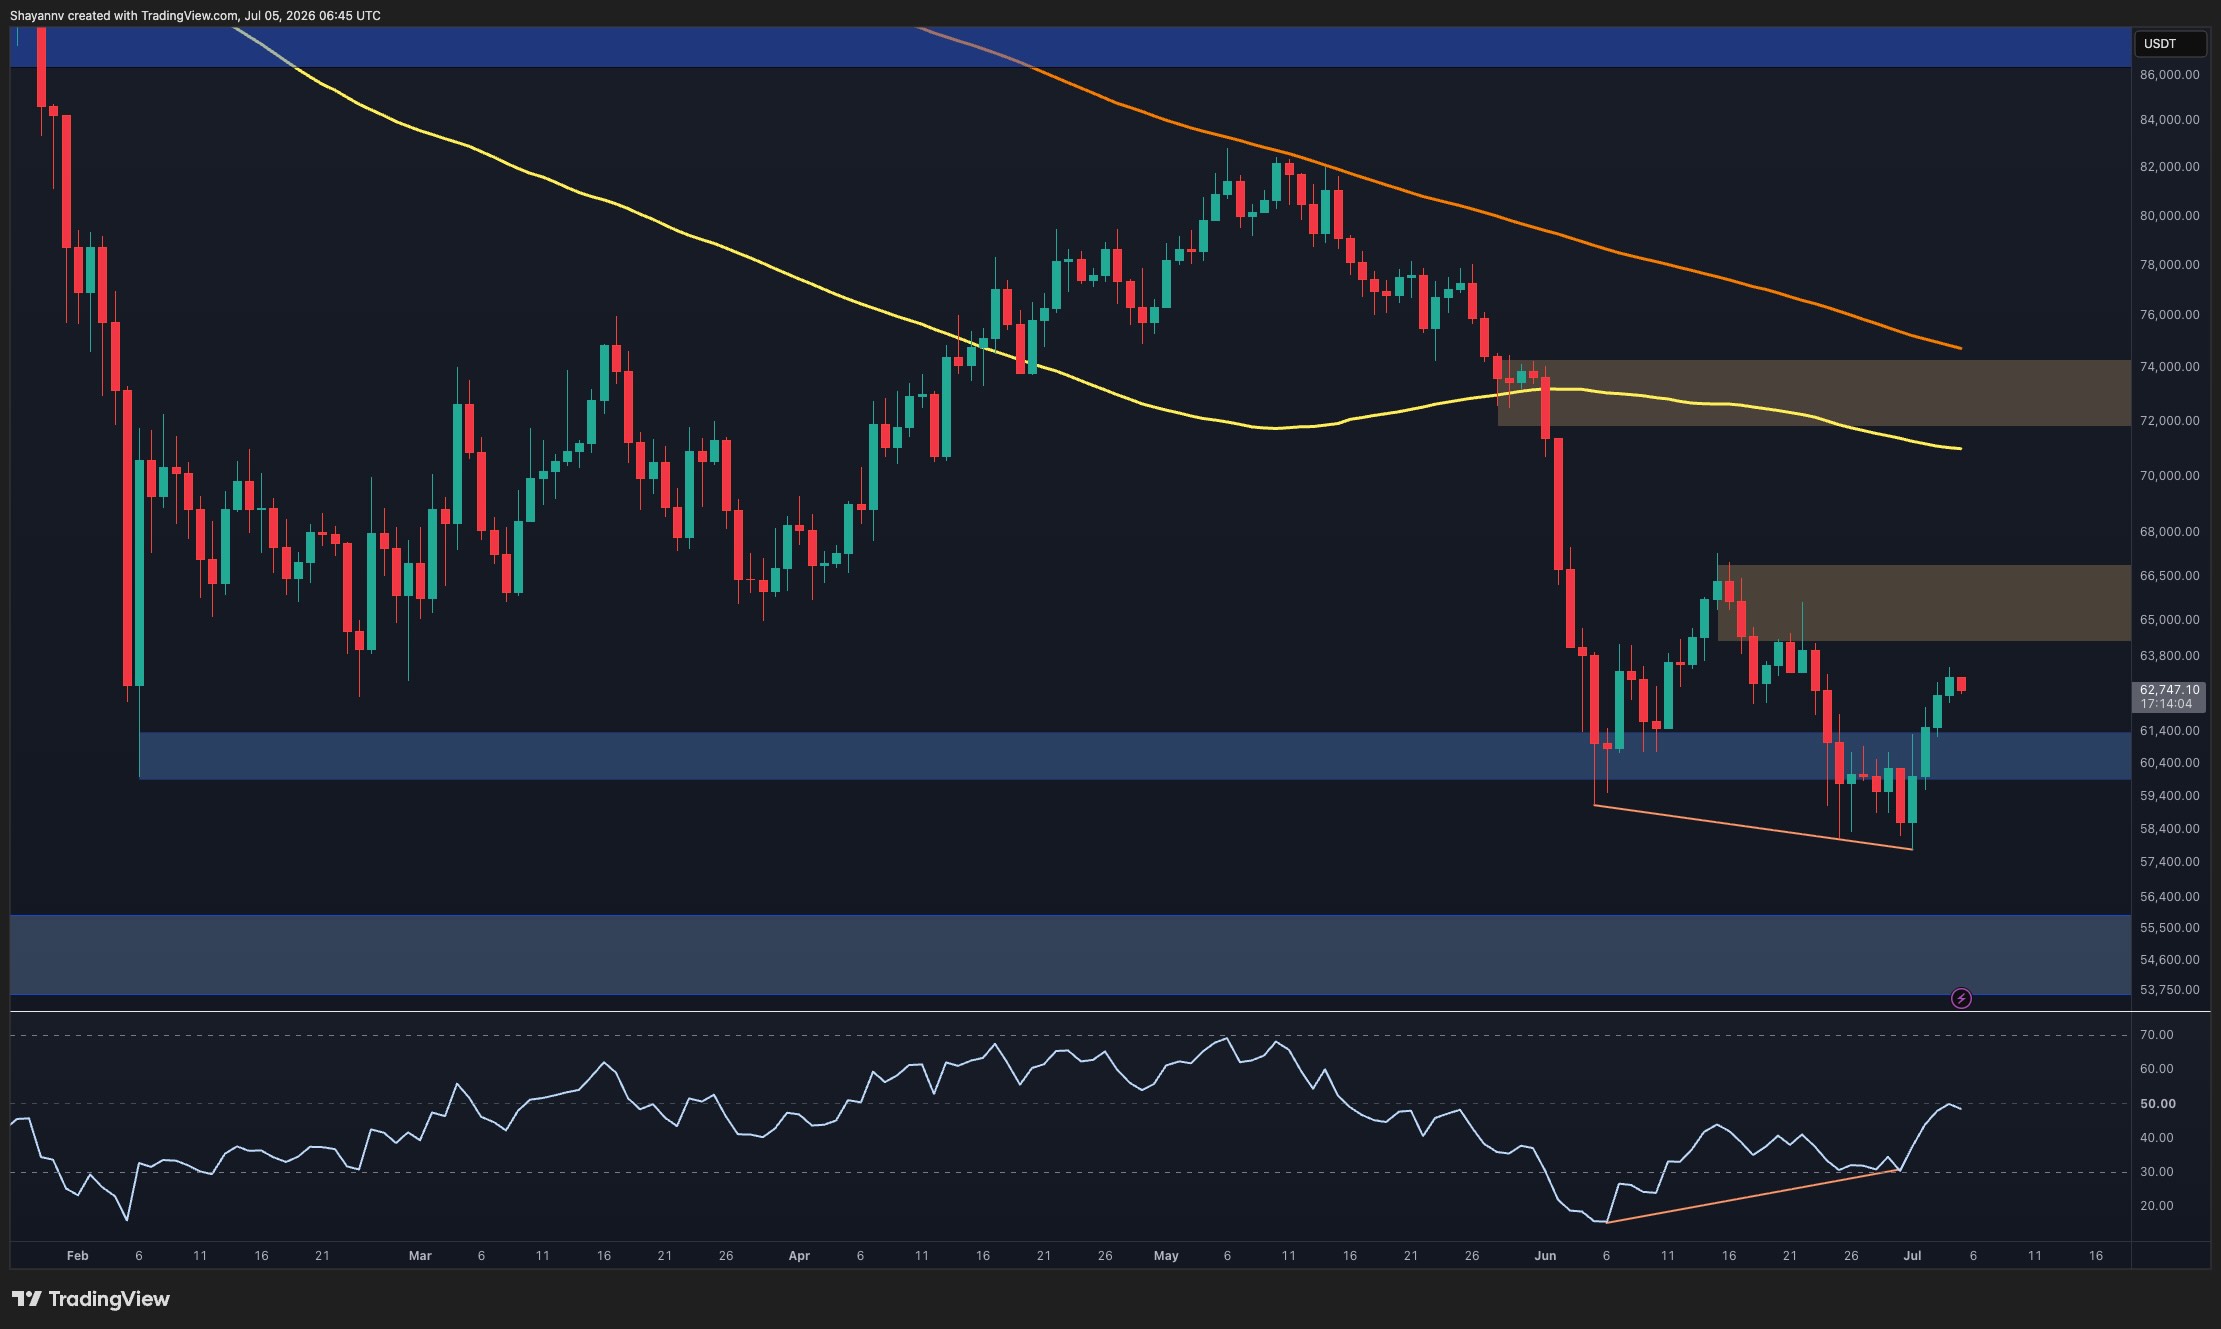
Bitcoin is currently attempting to break through a critical resistance cluster following a successful bounce from its June liquidity lows, signaling a potential short-term trend reversal for investors.
Bitcoin is currently showing signs of a short-term recovery after rebounding from June lows, but it faces significant resistance that must be cleared before a sustained rally can begin next week.
After a period of intense selling pressure, Bitcoin (BTC) has found a temporary floor. American investors watching the charts have seen the digital gold sweep through "liquidity" (zones where many buy and sell orders are clustered) below previous support levels. This move often clears out weak hands before a move higher. For those at home using platforms like Coinbase or Kraken, the question is whether this momentum can carry through into the coming week.
Understanding the Current Support and Resistance
The daily chart for Bitcoin shows a notable shift in sentiment. After touching lows not seen since early summer, buyers stepped in aggressively. However, the asset is now facing a "resistance cluster." This is a price range where a high volume of previous sell orders exists, making it difficult for the price to move upward without significant buying power.
To confirm a bullish (upward) trend, Bitcoin needs to reclaim several overhead levels. Technical analysts are specifically looking for a daily close above the 50-day moving average (an indicator that tracks the average price over the last 50 days). Until these levels are secured, the broader market structure remains technically bearish, meaning the path of least resistance could still be down.
The Role of Market Liquidity and Sentiment
Market liquidity plays a massive role in Bitcoin's price discovery. By "sweeping liquidity," Bitcoin effectively tapped into a pool of accumulated orders. This often acts as a spring, propelling the price back toward the mean. For the intermediate investor, this suggests that while volatility remains high, the immediate downside risk may have been mitigated for the short term.
Short-term momentum indicators, such as the Relative Strength Index (RSI), which measures the speed and change of price movements, are currently trending neutral to bullish. This suggests that the "oversold" conditions of previous weeks are fading. Investors are now transitioning from fear toward a more cautious optimism as the market stabilizes.
"The recent price action suggests that the market has processed the bulk of the recent selling pressure, but institutional conviction is required to break the $65,000 ceiling." — Market Analyst Insight.
DeFi and the Broader Ecosystem Impact
When Bitcoin finds stability, it often leads to increased activity in the Decentralized Finance (DeFi) sector. DeFi refers to financial services like lending or trading that operate on blockchains without traditional banks. A stable BTC price provides a "risk-on" environment where investors feel more comfortable moving capital into other digital assets.
Understanding these connections is vital for a balanced portfolio. For more background on how these decentralized systems function, you can read this Investopedia DeFi explainer. As Bitcoin leads, the rest of the market typically follows, making BTC the ultimate barometer for crypto health.
- Watch the Weekly Close: A close above $62,000 is considered a bullish signal by many US traders.
- Monitor Spot ETFs: Keep an eye on the inflows for BlackRock and Fidelity Bitcoin ETFs.
- Check Exchange Reserves: Low amounts of BTC on exchanges usually suggest less selling pressure.
What This Means for USA Investors
For investors in the United States, the current Bitcoin price movement happens against a backdrop of specific regulatory and tax considerations. The IRS (Internal Revenue Service) treats Bitcoin as property, meaning every time you trade BTC for another coin or sell it for USD, it is a taxable event. A price rally next week could provide opportunities for profit-taking, but you must keep detailed records of your cost basis.
The SEC (Securities and Exchange Commission) continues to keep a close watch on the industry. While Bitcoin is widely considered a non-security commodity by the CFTC (Commodity Futures Trading Commission), the platforms you trade on are under constant scrutiny. Following the price on US-regulated exchanges ensures you are seeing fair market value driven by domestic demand.
- Tax Planning: Consider the capital gains implications if you decide to sell during a price spike.
- USD Strength: A strong US Dollar (DXY) often puts downward pressure on Bitcoin prices.
- Regulatory Clarity: Stay tuned to any announcements regarding the FIT21 bill or similar crypto legislation.
Key Technical Levels to Monitor
Looking ahead to next week, two specific zones will dictate the narrative. On the downside, maintaining the $58,000 level is crucial. If Bitcoin drops below this, it could signal a re-test of the June lows. On the upside, the $64,000 to $66,000 range is the "danger zone" where sellers are expected to emerge. A clean break above $66,000 with high trading volume would likely invalidate the bearish thesis and open the door for a run toward previous all-time highs.
Key Takeaways
- Identify critical resistance clusters that Bitcoin must break to flip the current bearish trend.
- Monitor liquidity zones below June lows which acted as a catalyst for the recent price bounce.
- Evaluate short-term momentum indicators that suggest a potential move toward higher price targets.
- Assess the impact of U.S. macroeconomic data on the strength of the current Bitcoin recovery.
- Observe institutional buying patterns on major American exchanges like Coinbase and Kraken.