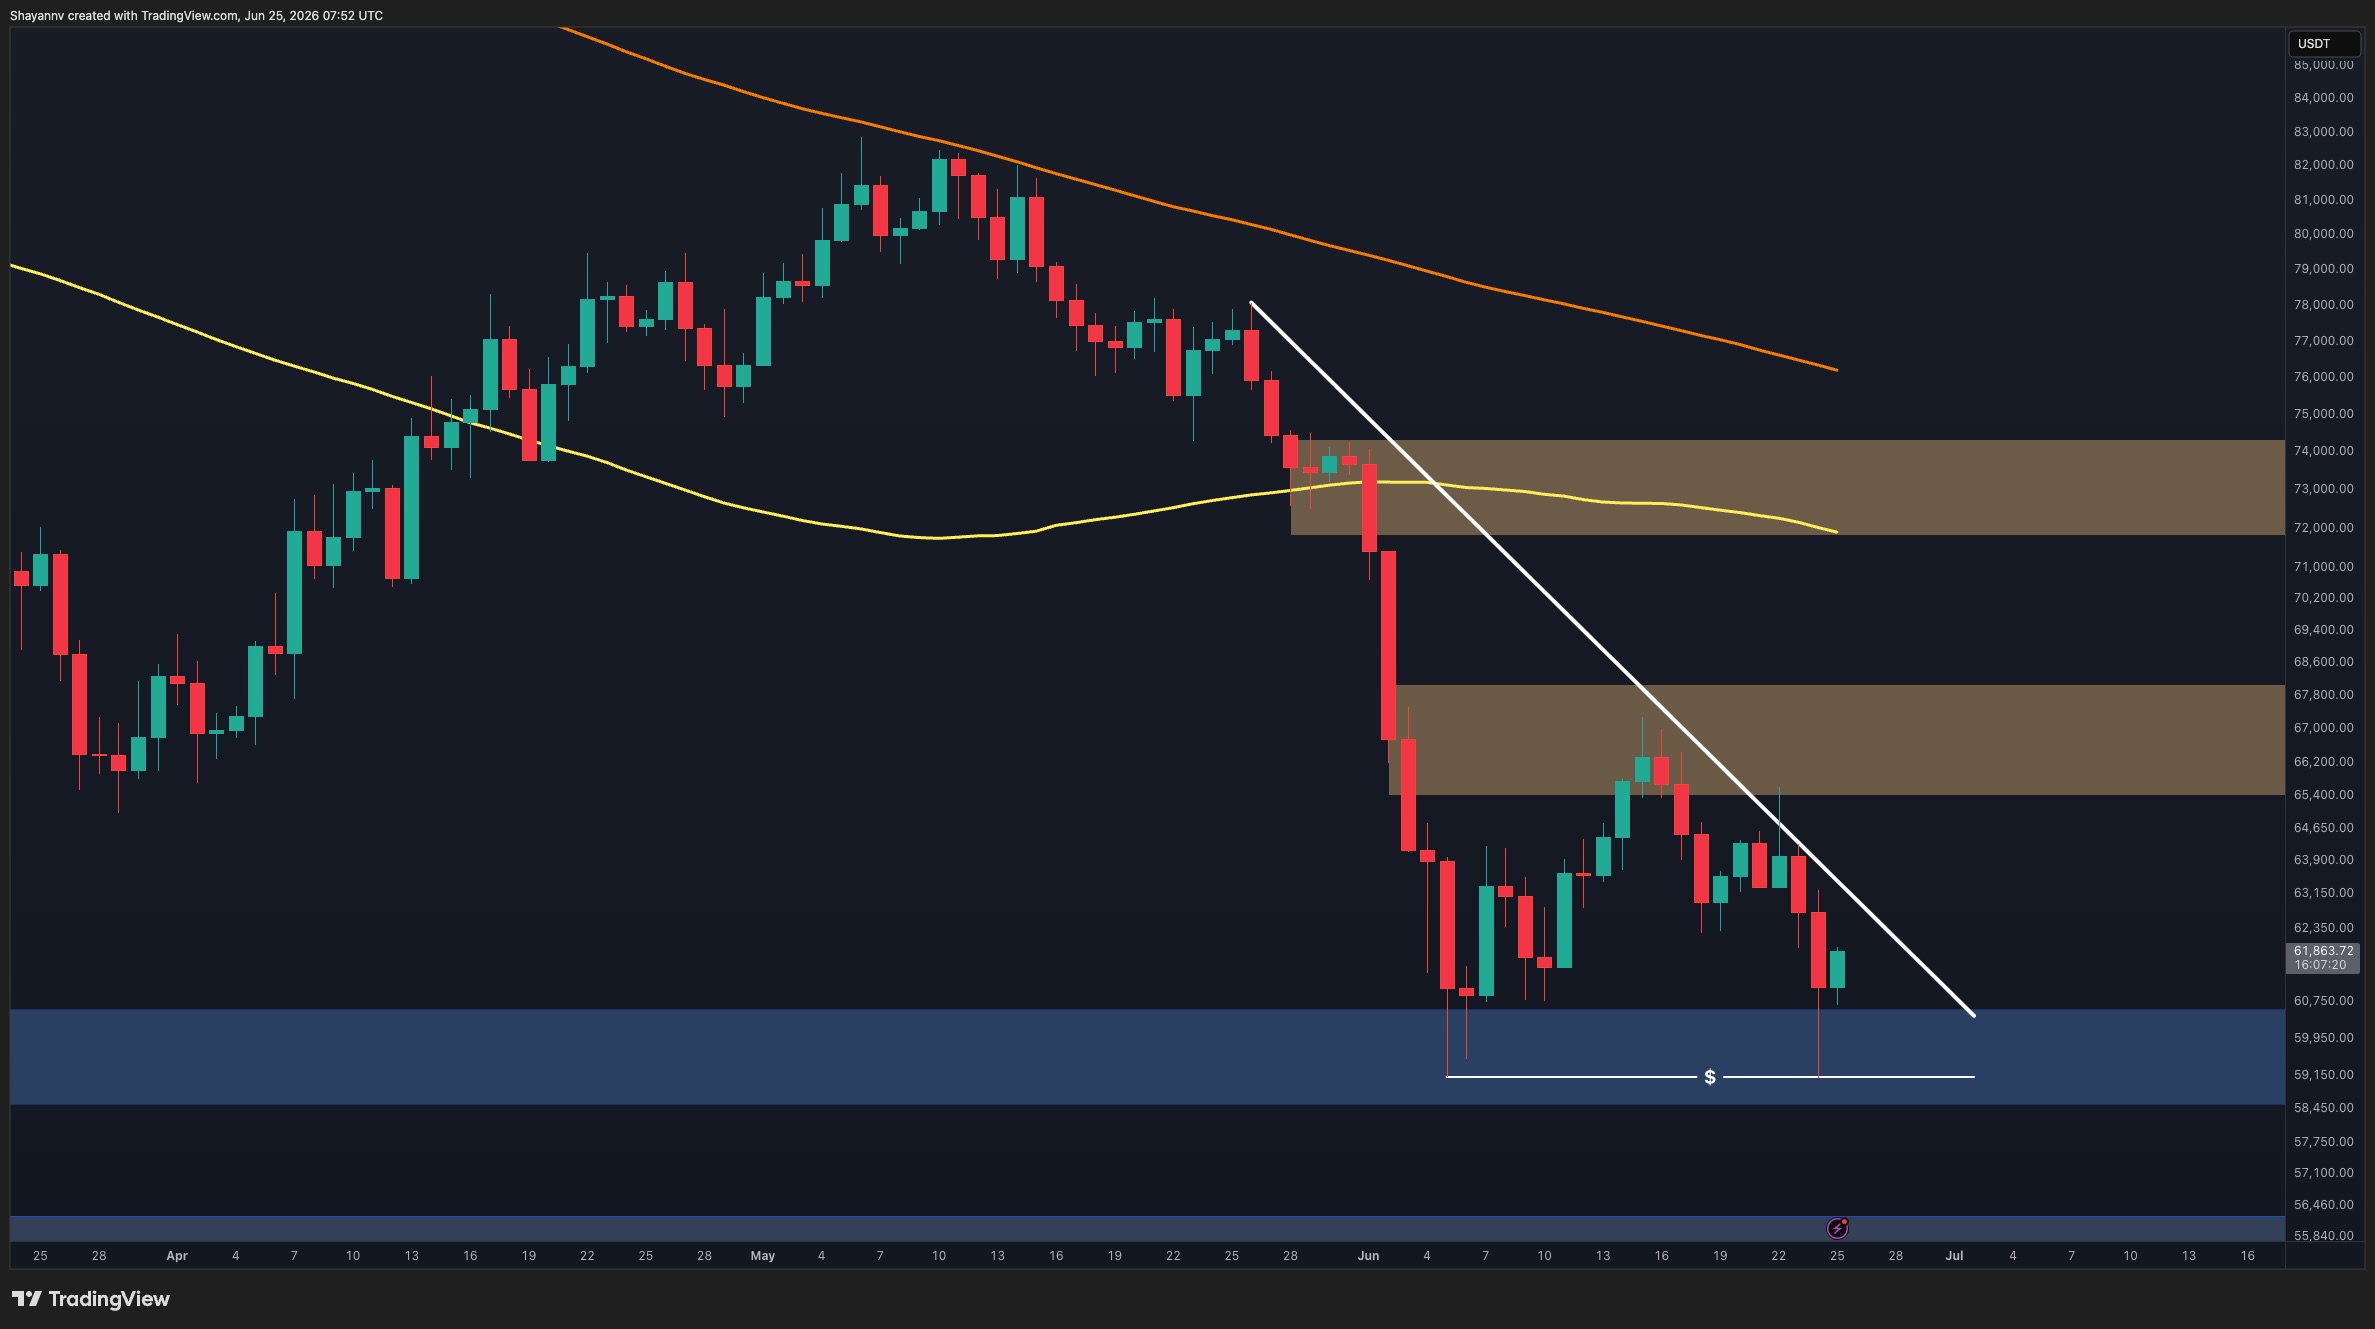
Bitcoin is currently battling to maintain its position above the $58,000 support level as technical indicators suggest a potential risk of another leg down in the coming weeks.
Bitcoin is currently hovering in a high-stakes demand zone between $58,000 and $60,000, facing technical resistance that suggests a risk of further drops if buyer momentum fails.
Markets across the United States are closely watching the pioneer cryptocurrency as it enters a period of high volatility. For American investors, the price action between $58,000 and $60,000 has become a critical psychological battleground. After a recent sweep of local lows, buyers on major US-regulated exchanges like Coinbase and Kraken managed to spark a modest recovery, but the bounce lacks the volume typically associated with a full trend reversal.
Understanding the $58,000 Demand Zone
In technical analysis, a demand zone (an area where buying interest is strong enough to overcome selling pressure) often acts as a floor for prices. Bitcoin has repeatedly touched this $58,000 mark over the past quarter, frequently finding enough "dip buyers" to prevent a total collapse. However, each subsequent test of a support level can weaken it, as the available buy orders are filled.
The daily chart shows that while bulls (investors who expect prices to rise) are defending this territory, they are struggling to push the price past immediate resistance levels. This lack of upward follow-through is causing concern among swing traders (investors who hold positions for days or weeks to profit from price shifts). If the $58,000 floor cracks, analysts are looking at the $54,000 to $52,000 range as the next logical stop for the market.
The Role of Technical Resistance
While the support is clear, the resistance (a price level where selling pressure prevents the price from rising further) is equally formidable. Specifically, the 200-day Moving Average (the average price over the last 200 days) is currently acting as a ceiling for Bitcoin. Breaking above this level is often seen as the dividing line between a bear market (a period of falling prices) and a bull market.
- Relative Strength Index (RSI): This momentum indicator is currently in neutral territory, suggesting the market is undecided.
- Trading Volume: US-based trading volume has remained steady but lacks the massive surge needed for a breakout.
- Moving Average Convergence Divergence (MACD): This tool shows a slight bearish crossover, indicating downward momentum may still have some steam.
Institutional Sentiment and US Markets
Despite the choppy price action, the institutional landscape in the US remains a core pillar of support. Wall Street's interest in Bitcoin has evolved significantly with the approval of Spot Bitcoin ETFs (Exchange Traded Funds that hold actual Bitcoin). These funds allow traditional investors to gain exposure to BTC through their standard brokerage accounts at firms like Fidelity or Charles Schwab.
"Bitcoin's current consolidation phase is a test of conviction for late-cycle buyers, as the market balances macro fears with long-term digital scarcity."
Many participants are looking toward Investopedia DeFi explainer to understand how decentralized finance protocols might interact with Bitcoin's price floor during high volatility. As more BTC is locked into various DeFi (financial services built on blockchain instead of traditional banks) platforms, the circulating supply on exchanges may decrease, potentially cushioning the blow of a sell-off.
Predicting the Next Major Move
The question on every investor's mind is whether the next move is up or down. To determine this, analysts are watching for a specific pattern of higher highs and higher lows. Currently, Bitcoin is doing the opposite—forming a series of lower highs, which is a classic bearish signal. To flip the narrative, BTC needs to close decisively above the $64,000 mark on high volume.
- Phase 1: Stabilization above the $60,000 level for at least 72 hours.
- Phase 2: A breakout above the 50-day and 200-day moving averages.
- Phase 3: A retest of the $70,000 psychological resistance level.
What This Means for USA Investors
For those filing taxes in the United States, remember that the IRS (Internal Revenue Service) treats Bitcoin as property, not currency. This means every time you trade BTC for another coin or sell it for USD, it is a taxable event. The current price volatility could offer an opportunity for Tax-Loss Harvesting (selling an asset at a loss to offset capital gains taxes), a strategy frequently used by sophisticated US investors during market dips.
From a regulatory standpoint, the SEC (Securities and Exchange Commission) continues to keep a close eye on exchange practices. Stick to reputable US platforms like Gemini or Coinbase to ensure your assets are protected by rigorous compliance standards. Furthermore, keep an eye on the Federal Reserve's interest rate decisions; higher rates often make "risk-on" assets like Bitcoin less attractive to American retail investors, potentially driving that second leg lower.
Key Takeaways
- Monitor the $58,000 support level as a breach could trigger a deeper correction toward $54,000.
- Watch for a breakout above the 200-day moving average to confirm a renewed bullish trend.
- Evaluate US macroeconomic data like CPI reports which are currently driving short-term BTC volatility.
- Track institutional inflows through US spot Bitcoin ETFs as a gauge for market sentiment.