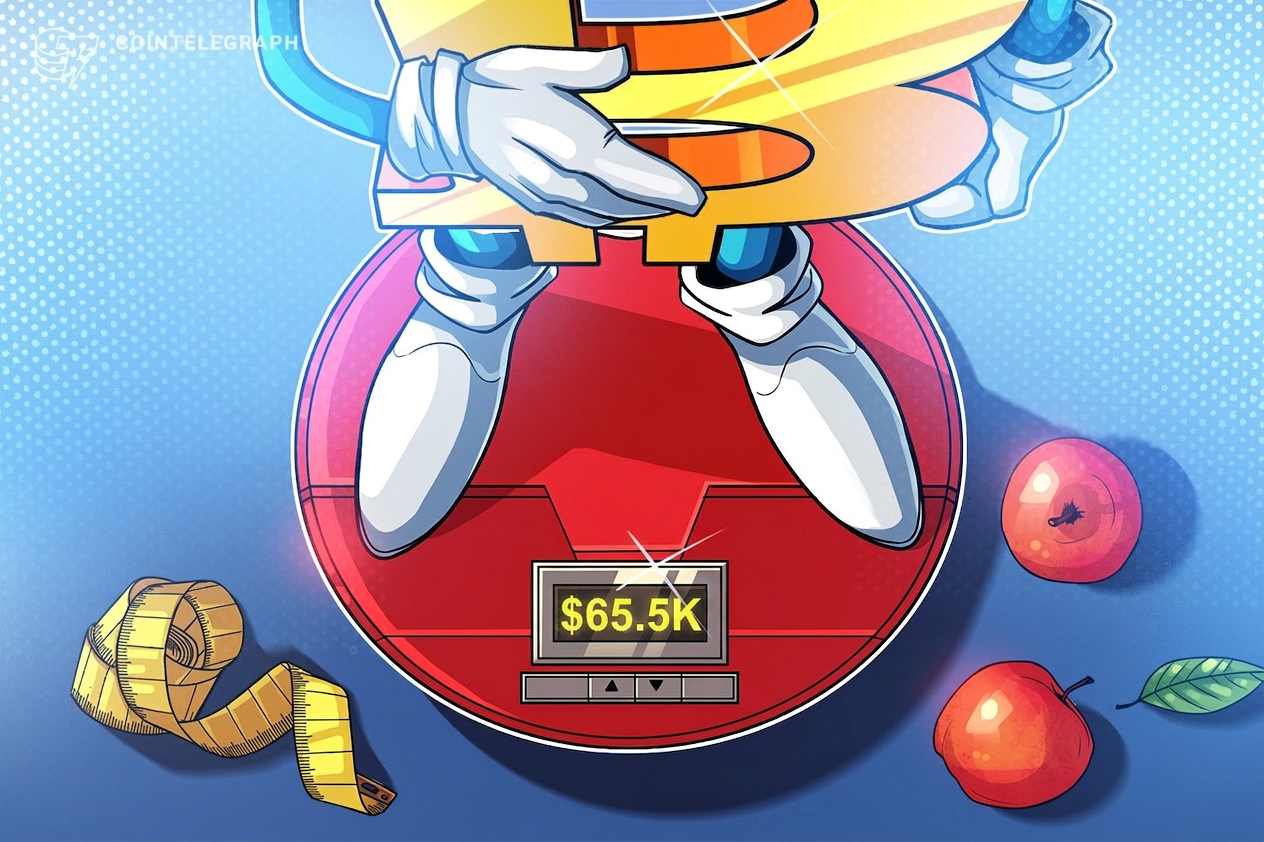
Bitcoin surged to a three-week high of $65,500 after cooler-than-expected U.S. inflation data boosted investor confidence in a potential interest rate cut.
Bitcoin climbed to a three-week high of $65,500 after the release of U.S. Producer Price Index (PPI) data, which suggested a cooling economy and increased the likelihood of Federal Reserve interest rate cuts.
The latest price action occurred on July 12, 2024, as the U.S. Bureau of Labor Statistics released the Producer Price Index (PPI), a measure of the change in prices received by domestic producers for their output. For American investors, this signal indicates that the inflationary pressures that have haunted the economy for two years may finally be receding.
Why the PPI Data Sparked a Bitcoin Rally
The PPI report serves as a leading indicator for consumer inflation. When production costs drop, consumer prices often follow. This "double-whammy" of positive macro data, following the earlier Consumer Price Index (CPI) report, has tricked the market into a "risk-on" mood.
As the U.S. Dollar Index (DXY) weakened, Bitcoin benefited from the inverse relationship between the greenback and digital assets. A weaker dollar makes Bitcoin cheaper for global buyers, driving up the spot price (the current market price for immediate delivery).
"The macro environment is shifting rapidly. With PPI coming in softer, the Federal Reserve has all the cover it needs to begin the transition toward a more accommodative monetary policy," noted one market strategist.
Breaking Down the Resistance Levels
Before this move, Bitcoin had been stuck in a sideways range. By breaking above $64,000, it cleared a significant liquidity zone (an area where many buy and sell orders are concentrated). Technical analysts look at these levels to determine if a trend has staying power.
According to data from CoinGecko, Bitcoin's market capitalization has reclaimed a dominant position, signaling that investors are rotating out of riskier assets and back into the "digital gold."
Key Metrics to Watch
- RSI (Relative Strength Index): Measures whether an asset is overbought or oversold.
- Funding Rates: Indicates the sentiment among professional traders using leverage.
- ETF Inflows: Shows how much new money is entering through U.S. Spot Bitcoin ETFs.
The Fed's Next Move: September Rate Cuts?
The big question for residents in the United States is when the Federal Reserve will lower interest rates. Higher interest rates typically hurt BTC because investors can get a decent return on "safe" assets like Treasury bonds. When rates fall, Bitcoin becomes more attractive.
- Initial market reaction drove BTC to $65,200 within minutes.
- Follow-through buying pushed the price toward $65,800.
- Long liquidations (traders bet on price drops) fueled the upward momentum.
What This Means for USA Investors
For U.S.-based investors, this rally is more than just a number on a screen. If you are trading on Coinbase, Kraken, or Gemini, you likely noticed an uptick in trading volume. This suggests that domestic retail interest is returning after a period of exhaustion.
From a tax perspective, remember that the IRS treats Bitcoin as property. Any gains realized from selling during this surge are subject to capital gains tax. If you've held your BTC for over a year, you may qualify for the more favorable long-term rate.
Furthermore, the SEC (Securities and Exchange Commission) continues to monitor exchange stability. While the regulatory environment remains complex, the successful operation of Spot ETFs has provided a regulated bridge for Americans to gain exposure without holding private keys (the digital codes used to access crypto) directly.
Conclusion: Is the Bull Market Back?
While hitting $65,500 is a bullish sign, investors should remain cautious. The market remains sensitive to geopolitical shifts and further employment data. A sustainable move above $67,000 would be the next major signal that the mid-summer slump is officially over. Stay tuned to MetroSkope for real-time updates on price action.
Key Takeaways
- Identify the $65,500 mark as a critical resistance level now turned into support.
- Monitor U.S. Producer Price Index (PPI) data as a primary catalyst for market volatility.
- Recognize that cooling inflation increases the probability of Fed rate cuts in September.
- Assess institutional demand on U.S. exchanges like Coinbase as a driver for the rally.